Crude Oil Price Update – Testing Longer-Term Support Areas
U.S. West Texas Intermediate crude oil futures are inching higher early Wednesday after plunging over 7 percent the previous session. Sellers hit the market hard on Tuesday on renewed concerns over the global supply glut. The catalysts were reports that showed the United States and Russia producing at record levels ahead of the start of the OPEC-led production cuts on January 1.
At 0712 GMT, February WTI crude oil futures are trading $46.70, up $0.10 or +0.21%.
Daily Swing Chart Technical Analysis
The main trend is down according to the daily swing chart. The market is in no position to change the trend to up, but it is in the window of time for a closing price reversal bottom. If formed, this could produce a 2-3 day counter-trend rally.
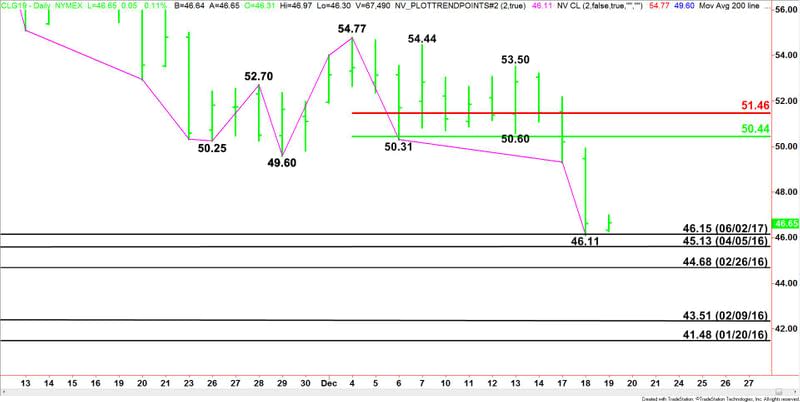
On Tuesday, the market tested the June 2, 2017 bottom at $46.15 before dropping further to $46.11. The market was able to close back above the previous bottom and is still holding above this level early Wednesday. Based on this price action, we’re going to call $46.15 to $46.11 minor support.
The new main range is $54.77 to $46.11. Its retracement zone at $50.44 to $51.46 is new resistance.
Daily Swing Chart Technical Forecast
Based on yesterday’s low and the early price action, the direction of the February WTI crude oil futures contract on Wednesday is likely to be determined by trader reaction to $46.11.
Bullish Scenario
A sustained move over $46.11 will indicate the presence of buyers. This could generate some intraday counter-trend buying with no particular upside target insight.
Bearish Scenario
Taking out $46.11 with conviction could drive the market into the April 5, 2016 bottom at $45.13. The daily chart starts to open up to the downside under this level with the February 26, 2016 bottom the next target.
The trigger point for an acceleration to the downside is $44.68. Taking out this level could trigger a steep drop into the February 9, 2016 bottom at $43.51 and the January 1, 2016 bottom at $41.48.
Closing Price Reversal Bottom
Taking out $46.11 then recapturing yesterday’s close at $46.60 will put the market in a position to form a potentially bullish closing price reversal bottom. We could see some short-covering on an intraday basis, but it needs to close over $46.60 to actually form the reversal bottom on the daily chart.
This article was originally posted on FX Empire
