Is CVB Financial Corp’s (CVBF) ROE Of 10.66% Sustainable?

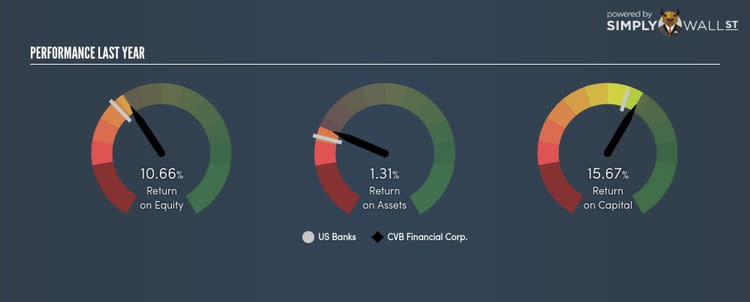
CVB Financial Corp (NASDAQ:CVBF) outperformed the Regional Banks industry on the basis of its ROE – producing a higher 10.66% relative to the peer average of 8.95% over the past 12 months. On the surface, this looks fantastic since we know that CVBF has made large profits from little equity capital; however, ROE doesn’t tell us if management have borrowed heavily to make this happen. Today, we’ll take a closer look at some factors like financial leverage to see how sustainable CVBF’s ROE is. View our latest analysis for CVB Financial
Breaking down ROE — the mother of all ratios
Firstly, Return on Equity, or ROE, is simply the percentage of last years’ earning against the book value of shareholders’ equity. An ROE of 10.66% implies $0.11 returned on every $1 invested. While a higher ROE is preferred in most cases, there are several other factors we should consider before drawing any conclusions.
Return on Equity = Net Profit ÷ Shareholders Equity
Returns are usually compared to costs to measure the efficiency of capital. CVBF’s cost of equity is 11.02%. Given a discrepancy of -0.36% between return and cost, this indicated that CVBF may be paying more for its capital than what it’s generating in return. ROE can be broken down into three different ratios: net profit margin, asset turnover, and financial leverage. This is called the Dupont Formula:
Dupont Formula
ROE = profit margin × asset turnover × financial leverage
ROE = (annual net profit ÷ sales) × (sales ÷ assets) × (assets ÷ shareholders’ equity)
ROE = annual net profit ÷ shareholders’ equity
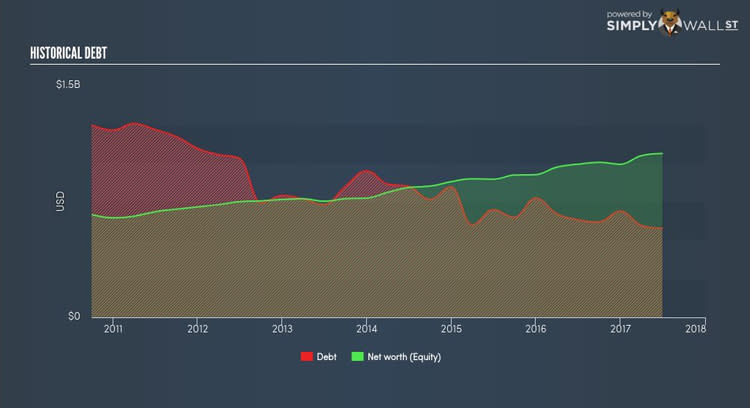
The first component is profit margin, which measures how much of sales is retained after the company pays for all its expenses. Asset turnover reveals how much revenue can be generated from CVBF’s asset base. Finally, financial leverage will be our main focus today. It shows how much of assets are funded by equity and can show how sustainable CVBF’s capital structure is. Since financial leverage can artificially inflate ROE, we need to look at how much debt CVBF currently has. At 54.40%, CVBF’s debt-to-equity ratio appears sensible and indicates the above-average ROE is generated from its capacity to increase profit without a large debt burden.
What this means for you:
Are you a shareholder? CVBF exhibits a strong ROE against its peers, however it was not high enough to cover its own cost of equity this year. Since its high ROE is not fuelled by unsustainable debt, investors shouldn’t give up as CVBF still has capacity to improve shareholder returns by borrowing to invest in new projects in the future.
Are you a potential investor? If you are considering investing in CVBF, looking at ROE on its own is not enough to make a well-informed decision. I recommend you do additional fundamental analysis by looking through our most recent infographic report on CVB Financial to help you make a more informed investment decision. If you are not interested in CVBF anymore, you can use our free platform to see our list of stocks with Return on Equity over 20%.
To help readers see pass the short term volatility of the financial market, we aim to bring you a long-term focused research analysis purely driven by fundamental data. Note that our analysis does not factor in the latest price sensitive company announcements.
The author is an independent contributor and at the time of publication had no position in the stocks mentioned.
