Danaher Corporation (DHR): Can It Deliver A Superior ROE To The Industry?

Danaher Corporation (NYSE:DHR) delivered a less impressive 9.70% ROE over the past year, compared to the 11.31% return generated by its industry. Though DHR’s recent performance is underwhelming, it is useful to understand what ROE is made up of and how it should be interpreted. Knowing these components can change your views on DHR’s below-average returns. I will take you through how metrics such as financial leverage impact ROE which may affect the overall sustainability of DHR’s returns. See our latest analysis for DHR
What you must know about ROE
Firstly, Return on Equity, or ROE, is simply the percentage of last years’ earning against the book value of shareholders’ equity. For example, if DHR invests $1 in the form of equity, it will generate $0.1 in earnings from this. Generally speaking, a higher ROE is preferred; however, there are other factors we must also consider before making any conclusions.
Return on Equity = Net Profit ÷ Shareholders Equity
ROE is measured against cost of equity in order to determine the efficiency of DHR’s equity capital deployed. Its cost of equity is 9.06%. While DHR’s peers may have higher ROE, it may also incur higher cost of equity. An undesirable and unsustainable practice would be if returns exceeded cost. However, this is not the case for DHR which is encouraging. ROE can be broken down into three different ratios: net profit margin, asset turnover, and financial leverage. This is called the Dupont Formula:
Dupont Formula
ROE = profit margin × asset turnover × financial leverage
ROE = (annual net profit ÷ sales) × (sales ÷ assets) × (assets ÷ shareholders’ equity)
ROE = annual net profit ÷ shareholders’ equity

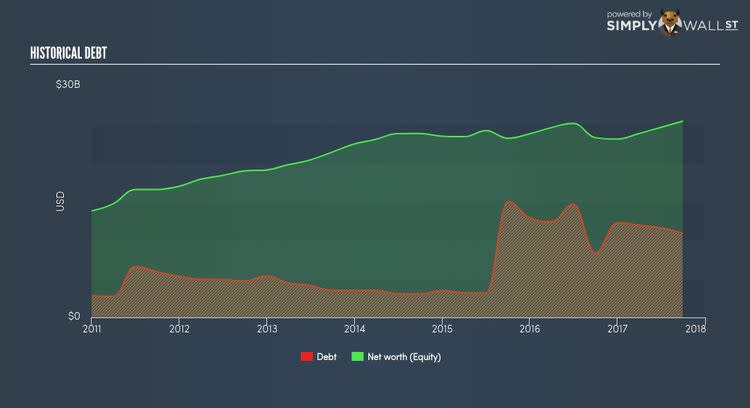
The first component is profit margin, which measures how much of sales is retained after the company pays for all its expenses. Asset turnover reveals how much revenue can be generated from DHR’s asset base. The most interesting ratio, and reflective of sustainability of its ROE, is financial leverage. Since ROE can be inflated by excessive debt, we need to examine DHR’s debt-to-equity level. At 42.98%, DHR’s debt-to-equity ratio appears low and indicates that DHR still has room to increase leverage and grow its profits.
What this means for you:
Are you a shareholder? Even though DHR returned below the industry average, its ROE comes in excess of its cost of equity. Since its high ROE is not likely driven by high debt, it might be a good time to top up on your current holdings if your fundamental research reaffirms this analysis. If you’re looking for new ideas for high-returning stocks, you should take a look at our free platform to see the list of stocks with Return on Equity over 20%.
Are you a potential investor? If you are considering investing in DHR, basing your decision on ROE alone is certainly not sufficient. I recommend you do additional fundamental analysis by looking through our most recent infographic report on Danaher to help you make a more informed investment decision.
To help readers see pass the short term volatility of the financial market, we aim to bring you a long-term focused research analysis purely driven by fundamental data. Note that our analysis does not factor in the latest price sensitive company announcements.
The author is an independent contributor and at the time of publication had no position in the stocks mentioned.
