Should We Be Delighted With Lycopodium Limited’s (ASX:LYL) ROE Of 23%?

Want to participate in a short research study? Help shape the future of investing tools and you could win a $250 gift card!
While some investors are already well versed in financial metrics (hat tip), this article is for those who would like to learn about Return On Equity (ROE) and why it is important. We’ll use ROE to examine Lycopodium Limited (ASX:LYL), by way of a worked example.
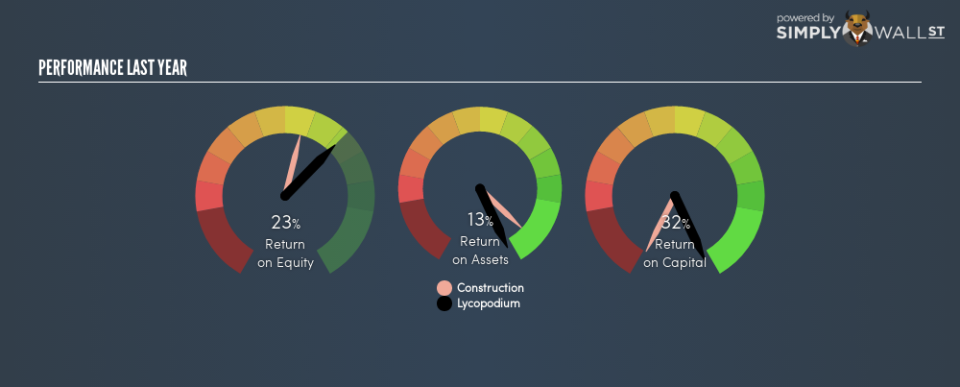
Our data shows Lycopodium has a return on equity of 23% for the last year. That means that for every A$1 worth of shareholders’ equity, it generated A$0.23 in profit.
See our latest analysis for Lycopodium
How Do You Calculate Return On Equity?
The formula for ROE is:
Return on Equity = Net Profit ÷ Shareholders’ Equity
Or for Lycopodium:
23% = 18.170186 ÷ AU$79m (Based on the trailing twelve months to June 2018.)
Most know that net profit is the total earnings after all expenses, but the concept of shareholders’ equity is a little more complicated. It is the capital paid in by shareholders, plus any retained earnings. The easiest way to calculate shareholders’ equity is to subtract the company’s total liabilities from the total assets.
What Does ROE Signify?
Return on Equity measures a company’s profitability against the profit it has kept for the business (plus any capital injections). The ‘return’ is the profit over the last twelve months. That means that the higher the ROE, the more profitable the company is. So, as a general rule, a high ROE is a good thing. Clearly, then, one can use ROE to compare different companies.
Does Lycopodium Have A Good ROE?
One simple way to determine if a company has a good return on equity is to compare it to the average for its industry. Importantly, this is far from a perfect measure, because companies differ significantly within the same industry classification. As is clear from the image below, Lycopodium has a better ROE than the average (18%) in the Construction industry.
That’s what I like to see. I usually take a closer look when a company has a better ROE than industry peers. For example you might check if insiders are buying shares.
Why You Should Consider Debt When Looking At ROE
Companies usually need to invest money to grow their profits. The cash for investment can come from prior year profits (retained earnings), issuing new shares, or borrowing. In the case of the first and second options, the ROE will reflect this use of cash, for growth. In the latter case, the debt used for growth will improve returns, but won’t affect the total equity. In this manner the use of debt will boost ROE, even though the core economics of the business stay the same.
Lycopodium’s Debt And Its 23% ROE
While Lycopodium does have a tiny amount of debt, with debt to equity of just 0.016, we think the use of debt is very modest. Its ROE is very impressive, and given only modest debt, this suggests the business is high quality. Conservative use of debt to boost returns is usually a good move for shareholders, though it does leave the company more exposed to interest rate rises.
In Summary
Return on equity is one way we can compare the business quality of different companies. Companies that can achieve high returns on equity without too much debt are generally of good quality. If two companies have around the same level of debt to equity, and one has a higher ROE, I’d generally prefer the one with higher ROE.
But when a business is high quality, the market often bids it up to a price that reflects this. Profit growth rates, versus the expectations reflected in the price of the stock, are a particularly important to consider. So I think it may be worth checking this free report on analyst forecasts for the company.
If you would prefer check out another company — one with potentially superior financials — then do not miss this free list of interesting companies, that have HIGH return on equity and low debt.
To help readers see past the short term volatility of the financial market, we aim to bring you a long-term focused research analysis purely driven by fundamental data. Note that our analysis does not factor in the latest price-sensitive company announcements.
The author is an independent contributor and at the time of publication had no position in the stocks mentioned. For errors that warrant correction please contact the editor at editorial-team@simplywallst.com.
