Dell Technologies Inc.’s (NYSE:DELL) Investment Returns Are Lagging Its Industry

Today we'll evaluate Dell Technologies Inc. (NYSE:DELL) to determine whether it could have potential as an investment idea. Specifically, we're going to calculate its Return On Capital Employed (ROCE), in the hopes of getting some insight into the business.
Firstly, we'll go over how we calculate ROCE. Then we'll compare its ROCE to similar companies. Last but not least, we'll look at what impact its current liabilities have on its ROCE.
What is Return On Capital Employed (ROCE)?
ROCE is a metric for evaluating how much pre-tax income (in percentage terms) a company earns on the capital invested in its business. Generally speaking a higher ROCE is better. In brief, it is a useful tool, but it is not without drawbacks. Renowned investment researcher Michael Mauboussin has suggested that a high ROCE can indicate that 'one dollar invested in the company generates value of more than one dollar'.
How Do You Calculate Return On Capital Employed?
Analysts use this formula to calculate return on capital employed:
Return on Capital Employed = Earnings Before Interest and Tax (EBIT) ÷ (Total Assets - Current Liabilities)
Or for Dell Technologies:
0.045 = US$3.0b ÷ (US$117b - US$49b) (Based on the trailing twelve months to November 2019.)
Therefore, Dell Technologies has an ROCE of 4.5%.
View our latest analysis for Dell Technologies
Is Dell Technologies's ROCE Good?
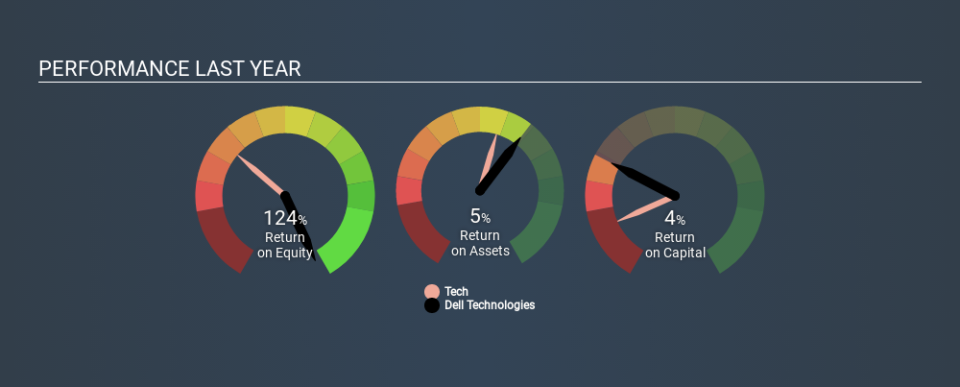
One way to assess ROCE is to compare similar companies. We can see Dell Technologies's ROCE is meaningfully below the Tech industry average of 8.9%. This performance could be negative if sustained, as it suggests the business may underperform its industry. Independently of how Dell Technologies compares to its industry, its ROCE in absolute terms is low; especially compared to the ~1.7% available in government bonds. There are potentially more appealing investments elsewhere.
Dell Technologies reported an ROCE of 4.5% -- better than 3 years ago, when the company didn't make a profit. That implies the business has been improving. The image below shows how Dell Technologies's ROCE compares to its industry, and you can click it to see more detail on its past growth.
It is important to remember that ROCE shows past performance, and is not necessarily predictive. ROCE can be misleading for companies in cyclical industries, with returns looking impressive during the boom times, but very weak during the busts. ROCE is only a point-in-time measure. What happens in the future is pretty important for investors, so we have prepared a free report on analyst forecasts for Dell Technologies.
How Dell Technologies's Current Liabilities Impact Its ROCE
Short term (or current) liabilities, are things like supplier invoices, overdrafts, or tax bills that need to be paid within 12 months. Due to the way ROCE is calculated, a high level of current liabilities makes a company look as though it has less capital employed, and thus can (sometimes unfairly) boost the ROCE. To counteract this, we check if a company has high current liabilities, relative to its total assets.
Dell Technologies has total assets of US$117b and current liabilities of US$49b. As a result, its current liabilities are equal to approximately 42% of its total assets. Dell Technologies has a medium level of current liabilities (boosting the ROCE somewhat), and a low ROCE.
What We Can Learn From Dell Technologies's ROCE
So researching other companies may be a better use of your time. You might be able to find a better investment than Dell Technologies. If you want a selection of possible winners, check out this free list of interesting companies that trade on a P/E below 20 (but have proven they can grow earnings).
If you are like me, then you will not want to miss this free list of growing companies that insiders are buying.
If you spot an error that warrants correction, please contact the editor at editorial-team@simplywallst.com. This article by Simply Wall St is general in nature. It does not constitute a recommendation to buy or sell any stock, and does not take account of your objectives, or your financial situation. Simply Wall St has no position in the stocks mentioned.
We aim to bring you long-term focused research analysis driven by fundamental data. Note that our analysis may not factor in the latest price-sensitive company announcements or qualitative material. Thank you for reading.
