Delta's July Traffic Data Strong on Solid Air Travel Demand
Delta Air Lines DAL reported impressive traffic figures for July. Consolidated traffic, measured in revenue passenger miles (RPMs), increased 5.2% to 23.77 billion on strong demand for air travel.
Consolidated capacity (or available seat miles/ASMs) also climbed 3.5% to 26.41 billion on a year-over-year basis. With traffic growth outpacing capacity expansion, load factor (percentage of seats filled by passengers) expanded140 basis points to 90%.
Additionally, this Zacks Rank #1 (Strong Buy) company recorded an on-time performance (mainline) of 80.9% and a completion factor (mainline) of 99.7%. Notably, Delta’s passenger count rose 6.3% to 19.4 million in the month. You can see the complete list of today’s Zacks #1 Rank stocks here.
Delta Air Lines, Inc. Price
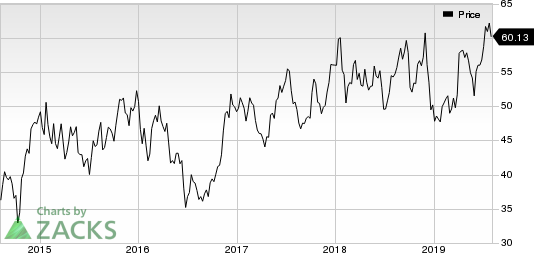
Delta Air Lines, Inc. price | Delta Air Lines, Inc. Quote
On a year-to-date basis, Delta registered RPMs of 138.57 billion (up 5.5%) and ASMs of 160.59 billion (up 4.6%). As a result, load factor improved 80 bps to 86.3%.
With the earnings season ongoing, let’s shed some light on the carrier’s second-quarter earnings report announced last month. The company’s earnings (excluding 14 cents from non-recurring items) of $2.35 per share outpaced the Zacks Consensus Estimate of $2.29 and also surged 32.8% on a year-over-year basis. Higher revenues aided the quarterly results.
Operating revenues totaled $12,536 million, which surpassed the Zacks Consensus Estimate of $12,499 million. Moreover, it compared favorably with the year-ago number. (Read more: Delta Stock Up on Q2 Earnings Beat, Upbeat View)
Other key airline players, namely United Airlines UAL, Alaska Air Group ALK and Spirit Airlines SAVE also reported better-than-expected earnings and revenues for second-quarter 2019.
Today's Best Stocks from Zacks
Would you like to see the updated picks from our best market-beating strategies? From 2017 through 2018, while the S&P 500 gained +15.8%, five of our screens returned +38.0%, +61.3%, +61.6%, +68.1%, and +98.3%.
This outperformance has not just been a recent phenomenon. From 2000 – 2018, while the S&P averaged +4.8% per year, our top strategies averaged up to +56.2% per year.
See their latest picks free >>
Want the latest recommendations from Zacks Investment Research? Today, you can download 7 Best Stocks for the Next 30 Days. Click to get this free report
Spirit Airlines, Inc. (SAVE) : Free Stock Analysis Report
United Airlines Holdings Inc (UAL) : Free Stock Analysis Report
Alaska Air Group, Inc. (ALK) : Free Stock Analysis Report
Delta Air Lines, Inc. (DAL) : Free Stock Analysis Report
To read this article on Zacks.com click here.
Zacks Investment Research
