Despite Its High P/E Ratio, Is AIA Group Limited (HKG:1299) Still Undervalued?

This article is for investors who would like to improve their understanding of price to earnings ratios (P/E ratios). We'll look at AIA Group Limited's (HKG:1299) P/E ratio and reflect on what it tells us about the company's share price. Based on the last twelve months, AIA Group's P/E ratio is 16.28. That is equivalent to an earnings yield of about 6.1%.
View our latest analysis for AIA Group
How Do I Calculate AIA Group's Price To Earnings Ratio?
The formula for P/E is:
Price to Earnings Ratio = Price per Share (in the reporting currency) ÷ Earnings per Share (EPS)
Or for AIA Group:
P/E of 16.28 = $8.985 ÷ $0.552 (Based on the trailing twelve months to December 2019.)
(Note: the above calculation uses the share price in the reporting currency, namely USD and the calculation results may not be precise due to rounding.)
Is A High P/E Ratio Good?
A higher P/E ratio implies that investors pay a higher price for the earning power of the business. All else being equal, it's better to pay a low price -- but as Warren Buffett said, 'It's far better to buy a wonderful company at a fair price than a fair company at a wonderful price'.
Does AIA Group Have A Relatively High Or Low P/E For Its Industry?
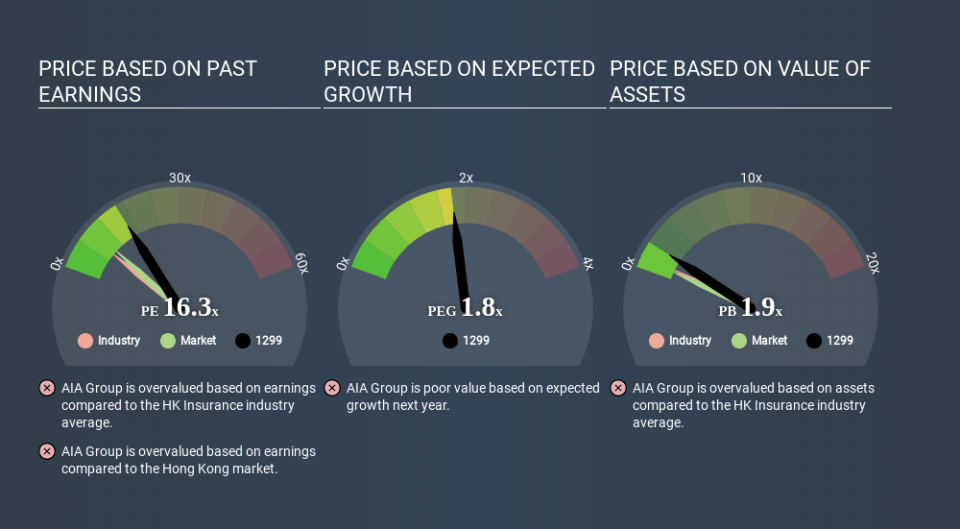
One good way to get a quick read on what market participants expect of a company is to look at its P/E ratio. The image below shows that AIA Group has a higher P/E than the average (8.2) P/E for companies in the insurance industry.
That means that the market expects AIA Group will outperform other companies in its industry. Shareholders are clearly optimistic, but the future is always uncertain. So investors should delve deeper. I like to check if company insiders have been buying or selling.
How Growth Rates Impact P/E Ratios
Probably the most important factor in determining what P/E a company trades on is the earnings growth. Earnings growth means that in the future the 'E' will be higher. That means even if the current P/E is high, it will reduce over time if the share price stays flat. So while a stock may look expensive based on past earnings, it could be cheap based on future earnings.
In the last year, AIA Group grew EPS like Taylor Swift grew her fan base back in 2010; the 127% gain was both fast and well deserved. And earnings per share have improved by 17% annually, over the last three years. So we'd absolutely expect it to have a relatively high P/E ratio.
A Limitation: P/E Ratios Ignore Debt and Cash In The Bank
One drawback of using a P/E ratio is that it considers market capitalization, but not the balance sheet. Thus, the metric does not reflect cash or debt held by the company. The exact same company would hypothetically deserve a higher P/E ratio if it had a strong balance sheet, than if it had a weak one with lots of debt, because a cashed up company can spend on growth.
Such expenditure might be good or bad, in the long term, but the point here is that the balance sheet is not reflected by this ratio.
So What Does AIA Group's Balance Sheet Tell Us?
With net cash of US$80b, AIA Group has a very strong balance sheet, which may be important for its business. Having said that, at 74% of its market capitalization the cash hoard would contribute towards a higher P/E ratio.
The Verdict On AIA Group's P/E Ratio
AIA Group trades on a P/E ratio of 16.3, which is above its market average of 9.5. The excess cash it carries is the gravy on top its fast EPS growth. So based on this analysis we'd expect AIA Group to have a high P/E ratio.
Investors have an opportunity when market expectations about a stock are wrong. If the reality for a company is better than it expects, you can make money by buying and holding for the long term. So this free visual report on analyst forecasts could hold the key to an excellent investment decision.
Of course you might be able to find a better stock than AIA Group. So you may wish to see this free collection of other companies that have grown earnings strongly.
If you spot an error that warrants correction, please contact the editor at editorial-team@simplywallst.com. This article by Simply Wall St is general in nature. It does not constitute a recommendation to buy or sell any stock, and does not take account of your objectives, or your financial situation. Simply Wall St has no position in the stocks mentioned.
We aim to bring you long-term focused research analysis driven by fundamental data. Note that our analysis may not factor in the latest price-sensitive company announcements or qualitative material. Thank you for reading.
