Despite Its High P/E Ratio, Is Pennon Group Plc (LON:PNN) Still Undervalued?

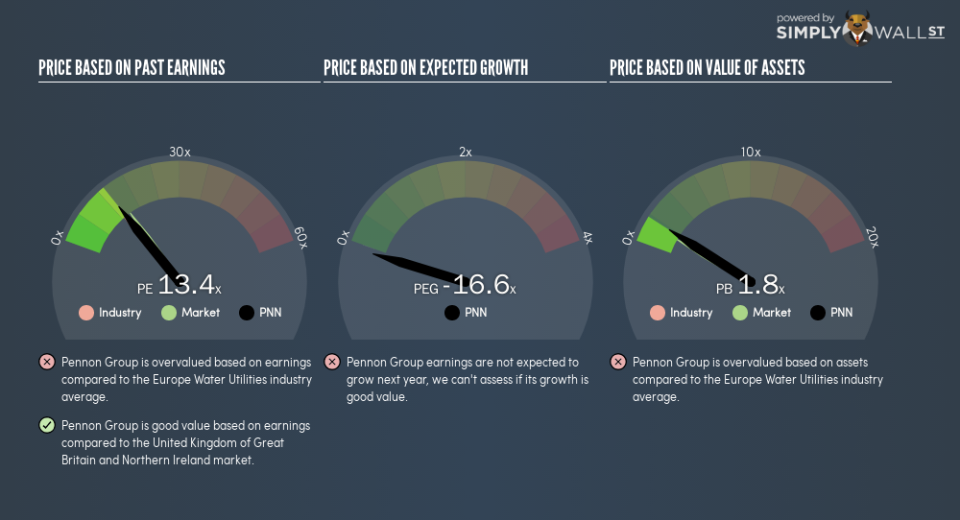
The goal of this article is to teach you how to use price to earnings ratios (P/E ratios). We’ll look at Pennon Group Plc’s (LON:PNN) P/E ratio and reflect on what it tells us about the company’s share price. Pennon Group has a price to earnings ratio of 13.38, based on the last twelve months. That is equivalent to an earnings yield of about 7.5%.
View our latest analysis for Pennon Group
How Do You Calculate A P/E Ratio?
The formula for P/E is:
Price to Earnings Ratio = Price per Share ÷ Earnings per Share (EPS)
Or for Pennon Group:
P/E of 13.38 = £6.93 ÷ £0.52 (Based on the trailing twelve months to September 2018.)
Is A High P/E Ratio Good?
A higher P/E ratio means that buyers have to pay a higher price for each £1 the company has earned over the last year. That isn’t a good or a bad thing on its own, but a high P/E means that buyers have a higher opinion of the business’s prospects, relative to stocks with a lower P/E.
How Growth Rates Impact P/E Ratios
Earnings growth rates have a big influence on P/E ratios. That’s because companies that grow earnings per share quickly will rapidly increase the ‘E’ in the equation. That means even if the current P/E is high, it will reduce over time if the share price stays flat. So while a stock may look expensive based on past earnings, it could be cheap based on future earnings.
It’s great to see that Pennon Group grew EPS by 18% in the last year. And its annual EPS growth rate over 5 years is 14%. This could arguably justify a relatively high P/E ratio.
How Does Pennon Group’s P/E Ratio Compare To Its Peers?
The P/E ratio essentially measures market expectations of a company. As you can see below Pennon Group has a P/E ratio that is fairly close for the average for the water utilities industry, which is 12.7.
That indicates that the market expects Pennon Group will perform roughly in line with other companies in its industry. If the company has better than average prospects, then the market might be underestimating it. Further research into factors such asmanagement tenure, could help you form your own view on whether that is likely.
Don’t Forget: The P/E Does Not Account For Debt or Bank Deposits
It’s important to note that the P/E ratio considers the market capitalization, not the enterprise value. In other words, it does not consider any debt or cash that the company may have on the balance sheet. In theory, a company can lower its future P/E ratio by using cash or debt to invest in growth.
Such expenditure might be good or bad, in the long term, but the point here is that the balance sheet is not reflected by this ratio.
How Does Pennon Group’s Debt Impact Its P/E Ratio?
Pennon Group has net debt worth a very significant 106% of its market capitalization. If you want to compare its P/E ratio to other companies, you must keep in mind that these debt levels would usually warrant a relatively low P/E.
The Bottom Line On Pennon Group’s P/E Ratio
Pennon Group’s P/E is 13.4 which is below average (14.7) in the GB market. The company has a meaningful amount of debt on the balance sheet, but that should not eclipse the solid earnings growth. If the company can continue to grow earnings, then the current P/E may be unjustifiably low.
Investors have an opportunity when market expectations about a stock are wrong. If it is underestimating a company, investors can make money by buying and holding the shares until the market corrects itself. So this free report on the analyst consensus forecasts could help you make a master move on this stock.
But note: Pennon Group may not be the best stock to buy. So take a peek at this free list of interesting companies with strong recent earnings growth (and a P/E ratio below 20).
To help readers see past the short term volatility of the financial market, we aim to bring you a long-term focused research analysis purely driven by fundamental data. Note that our analysis does not factor in the latest price-sensitive company announcements.
The author is an independent contributor and at the time of publication had no position in the stocks mentioned. For errors that warrant correction please contact the editor at editorial-team@simplywallst.com.
