Despite Its High P/E Ratio, Is FLIR Systems, Inc. (NASDAQ:FLIR) Still Undervalued?

The goal of this article is to teach you how to use price to earnings ratios (P/E ratios). We'll look at FLIR Systems, Inc.'s (NASDAQ:FLIR) P/E ratio and reflect on what it tells us about the company's share price. What is FLIR Systems's P/E ratio? Well, based on the last twelve months it is 23.64. That means that at current prices, buyers pay $23.64 for every $1 in trailing yearly profits.
Check out our latest analysis for FLIR Systems
How Do I Calculate A Price To Earnings Ratio?
The formula for P/E is:
Price to Earnings Ratio = Price per Share ÷ Earnings per Share (EPS)
Or for FLIR Systems:
P/E of 23.64 = $48.45 ÷ $2.05 (Based on the trailing twelve months to December 2018.)
Is A High Price-to-Earnings Ratio Good?
A higher P/E ratio implies that investors pay a higher price for the earning power of the business. That isn't a good or a bad thing on its own, but a high P/E means that buyers have a higher opinion of the business's prospects, relative to stocks with a lower P/E.
How Growth Rates Impact P/E Ratios
Generally speaking the rate of earnings growth has a profound impact on a company's P/E multiple. Earnings growth means that in the future the 'E' will be higher. That means even if the current P/E is high, it will reduce over time if the share price stays flat. Then, a lower P/E should attract more buyers, pushing the share price up.
In the last year, FLIR Systems grew EPS like Taylor Swift grew her fan base back in 2010; the 163% gain was both fast and well deserved. Having said that, if we look back three years, EPS growth has averaged a comparatively less impressive 5.7%.
How Does FLIR Systems's P/E Ratio Compare To Its Peers?
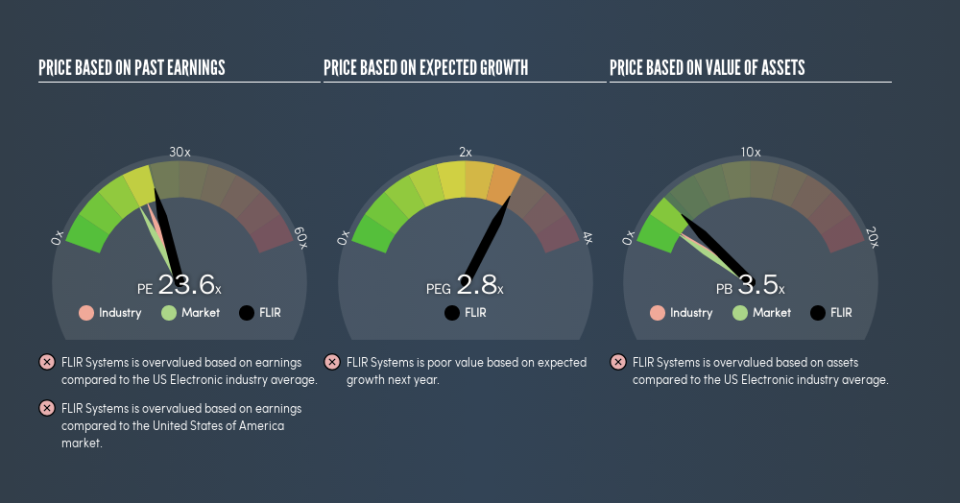
The P/E ratio essentially measures market expectations of a company. You can see in the image below that the average P/E (20.8) for companies in the electronic industry is lower than FLIR Systems's P/E.
Its relatively high P/E ratio indicates that FLIR Systems shareholders think it will perform better than other companies in its industry classification. Shareholders are clearly optimistic, but the future is always uncertain. So investors should delve deeper. I like to check if company insiders have been buying or selling.
A Limitation: P/E Ratios Ignore Debt and Cash In The Bank
Don't forget that the P/E ratio considers market capitalization. Thus, the metric does not reflect cash or debt held by the company. The exact same company would hypothetically deserve a higher P/E ratio if it had a strong balance sheet, than if it had a weak one with lots of debt, because a cashed up company can spend on growth.
Such expenditure might be good or bad, in the long term, but the point here is that the balance sheet is not reflected by this ratio.
How Does FLIR Systems's Debt Impact Its P/E Ratio?
Since FLIR Systems holds net cash of US$90m, it can spend on growth, justifying a higher P/E ratio than otherwise.
The Verdict On FLIR Systems's P/E Ratio
FLIR Systems has a P/E of 23.6. That's higher than the average in the US market, which is 17.9. The excess cash it carries is the gravy on top its fast EPS growth. To us, this is the sort of company that we would expect to carry an above average price tag (relative to earnings).
When the market is wrong about a stock, it gives savvy investors an opportunity. As value investor Benjamin Graham famously said, 'In the short run, the market is a voting machine but in the long run, it is a weighing machine.' So this free visualization of the analyst consensus on future earnings could help you make the right decision about whether to buy, sell, or hold.
But note: FLIR Systems may not be the best stock to buy. So take a peek at this free list of interesting companies with strong recent earnings growth (and a P/E ratio below 20).
We aim to bring you long-term focused research analysis driven by fundamental data. Note that our analysis may not factor in the latest price-sensitive company announcements or qualitative material.
If you spot an error that warrants correction, please contact the editor at editorial-team@simplywallst.com. This article by Simply Wall St is general in nature. It does not constitute a recommendation to buy or sell any stock, and does not take account of your objectives, or your financial situation. Simply Wall St has no position in the stocks mentioned. Thank you for reading.
