Despite Its High P/E Ratio, Is American Shared Hospital Services (NYSEMKT:AMS) Still Undervalued?

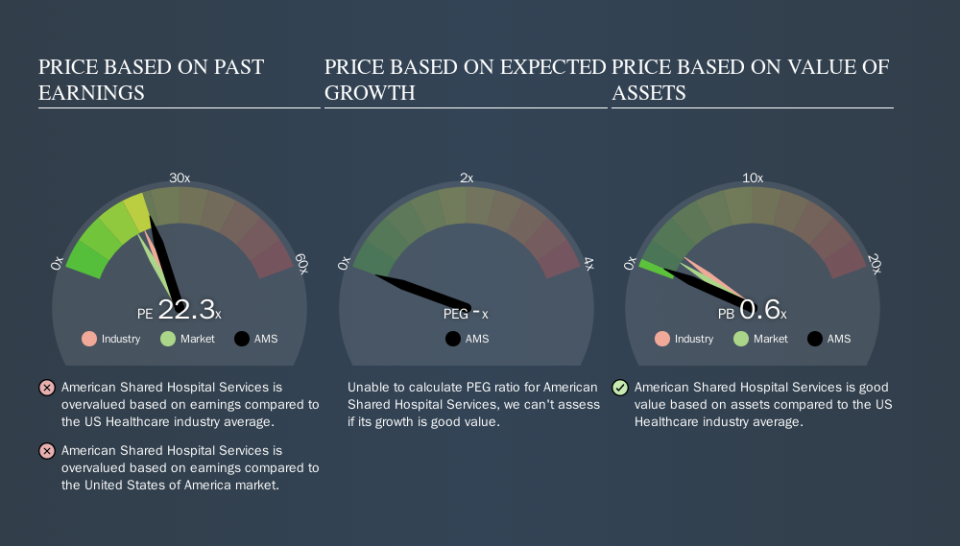
The goal of this article is to teach you how to use price to earnings ratios (P/E ratios). We'll show how you can use American Shared Hospital Services's (NYSEMKT:AMS) P/E ratio to inform your assessment of the investment opportunity. Looking at earnings over the last twelve months, American Shared Hospital Services has a P/E ratio of 22.35. That corresponds to an earnings yield of approximately 4.5%.
View our latest analysis for American Shared Hospital Services
How Do I Calculate A Price To Earnings Ratio?
The formula for price to earnings is:
Price to Earnings Ratio = Price per Share ÷ Earnings per Share (EPS)
Or for American Shared Hospital Services:
P/E of 22.35 = $2.47 ÷ $0.11 (Based on the year to June 2019.)
Is A High Price-to-Earnings Ratio Good?
A higher P/E ratio implies that investors pay a higher price for the earning power of the business. That isn't a good or a bad thing on its own, but a high P/E means that buyers have a higher opinion of the business's prospects, relative to stocks with a lower P/E.
How Does American Shared Hospital Services's P/E Ratio Compare To Its Peers?
The P/E ratio indicates whether the market has higher or lower expectations of a company. The image below shows that American Shared Hospital Services has a higher P/E than the average (19.6) P/E for companies in the healthcare industry.
That means that the market expects American Shared Hospital Services will outperform other companies in its industry. The market is optimistic about the future, but that doesn't guarantee future growth. So further research is always essential. I often monitor director buying and selling.
How Growth Rates Impact P/E Ratios
Generally speaking the rate of earnings growth has a profound impact on a company's P/E multiple. Earnings growth means that in the future the 'E' will be higher. That means unless the share price increases, the P/E will reduce in a few years. A lower P/E should indicate the stock is cheap relative to others -- and that may attract buyers.
American Shared Hospital Services shrunk earnings per share by 71% over the last year. But EPS is up 9.8% over the last 3 years.
Remember: P/E Ratios Don't Consider The Balance Sheet
The 'Price' in P/E reflects the market capitalization of the company. In other words, it does not consider any debt or cash that the company may have on the balance sheet. The exact same company would hypothetically deserve a higher P/E ratio if it had a strong balance sheet, than if it had a weak one with lots of debt, because a cashed up company can spend on growth.
Such spending might be good or bad, overall, but the key point here is that you need to look at debt to understand the P/E ratio in context.
How Does American Shared Hospital Services's Debt Impact Its P/E Ratio?
American Shared Hospital Services's net debt is 18% of its market cap. It would probably deserve a higher P/E ratio if it was net cash, since it would have more options for growth.
The Bottom Line On American Shared Hospital Services's P/E Ratio
American Shared Hospital Services's P/E is 22.3 which is above average (17.4) in its market. With modest debt but no EPS growth in the last year, it's fair to say the P/E implies some optimism about future earnings, from the market.
Investors have an opportunity when market expectations about a stock are wrong. If the reality for a company is better than it expects, you can make money by buying and holding for the long term. Although we don't have analyst forecasts you could get a better understanding of its growth by checking out this more detailed historical graph of earnings, revenue and cash flow.
But note: American Shared Hospital Services may not be the best stock to buy. So take a peek at this free list of interesting companies with strong recent earnings growth (and a P/E ratio below 20).
We aim to bring you long-term focused research analysis driven by fundamental data. Note that our analysis may not factor in the latest price-sensitive company announcements or qualitative material.
If you spot an error that warrants correction, please contact the editor at editorial-team@simplywallst.com. This article by Simply Wall St is general in nature. It does not constitute a recommendation to buy or sell any stock, and does not take account of your objectives, or your financial situation. Simply Wall St has no position in the stocks mentioned. Thank you for reading.
