Despite Its High P/E Ratio, Is Kingstone Companies, Inc. (NASDAQ:KINS) Still Undervalued?

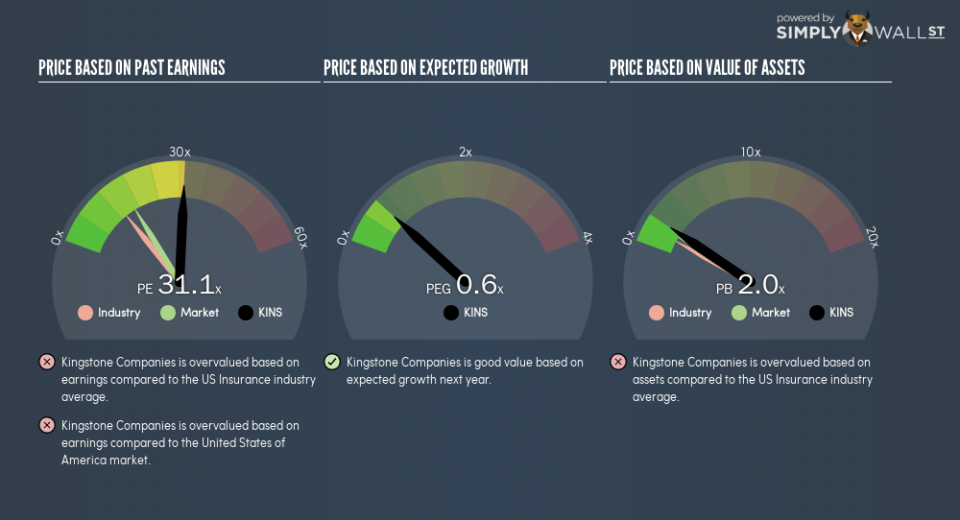
This article is written for those who want to get better at using price to earnings ratios (P/E ratios). To keep it practical, we’ll show how Kingstone Companies, Inc.’s (NASDAQ:KINS) P/E ratio could help you assess the value on offer. Based on the last twelve months, Kingstone Companies’s P/E ratio is 31.15. That means that at current prices, buyers pay $31.15 for every $1 in trailing yearly profits.
Check out our latest analysis for Kingstone Companies
How Do I Calculate A Price To Earnings Ratio?
The formula for P/E is:
Price to Earnings Ratio = Share Price ÷ Earnings per Share (EPS)
Or for Kingstone Companies:
P/E of 31.15 = $17.25 ÷ $0.55 (Based on the year to September 2018.)
Is A High Price-to-Earnings Ratio Good?
A higher P/E ratio means that investors are paying a higher price for each $1 of company earnings. That isn’t a good or a bad thing on its own, but a high P/E means that buyers have a higher opinion of the business’s prospects, relative to stocks with a lower P/E.
How Growth Rates Impact P/E Ratios
Companies that shrink earnings per share quickly will rapidly decrease the ‘E’ in the equation. That means even if the current P/E is low, it will increase over time if the share price stays flat. Then, a higher P/E might scare off shareholders, pushing the share price down.
Kingstone Companies’s earnings per share fell by 47% in the last twelve months. But over the longer term (5 years) earnings per share have increased by 9.5%. And EPS is down 15% a year, over the last 3 years. This growth rate might warrant a low P/E ratio.
How Does Kingstone Companies’s P/E Ratio Compare To Its Peers?
The P/E ratio indicates whether the market has higher or lower expectations of a company. The image below shows that Kingstone Companies has a higher P/E than the average (13.5) P/E for companies in the insurance industry.
Kingstone Companies’s P/E tells us that market participants think the company will perform better than its industry peers, going forward. Clearly the market expects growth, but it isn’t guaranteed. So further research is always essential. I often monitor director buying and selling.
A Limitation: P/E Ratios Ignore Debt and Cash In The Bank
It’s important to note that the P/E ratio considers the market capitalization, not the enterprise value. In other words, it does not consider any debt or cash that the company may have on the balance sheet. In theory, a company can lower its future P/E ratio by using cash or debt to invest in growth.
Such expenditure might be good or bad, in the long term, but the point here is that the balance sheet is not reflected by this ratio.
How Does Kingstone Companies’s Debt Impact Its P/E Ratio?
Kingstone Companies has net cash of US$642k. That should lead to a higher P/E than if it did have debt, because its strong balance sheets gives it more options.
The Bottom Line On Kingstone Companies’s P/E Ratio
Kingstone Companies’s P/E is 31.1 which is above average (16.7) in the US market. The recent drop in earnings per share would make some investors cautious, but the healthy balance sheet means the company retains potential for future growth. If fails to eventuate, the current high P/E could prove to be temporary, as the share price falls.
When the market is wrong about a stock, it gives savvy investors an opportunity. If the reality for a company is better than it expects, you can make money by buying and holding for the long term. So this free visual report on analyst forecasts could hold they key to an excellent investment decision.
Of course, you might find a fantastic investment by looking at a few good candidates. So take a peek at this free list of companies with modest (or no) debt, trading on a P/E below 20.
To help readers see past the short term volatility of the financial market, we aim to bring you a long-term focused research analysis purely driven by fundamental data. Note that our analysis does not factor in the latest price-sensitive company announcements.
The author is an independent contributor and at the time of publication had no position in the stocks mentioned. For errors that warrant correction please contact the editor at editorial-team@simplywallst.com.
