Despite Its High P/E Ratio, Is Tingyi (Cayman Islands) Holding Corp (HKG:322) Still Undervalued?

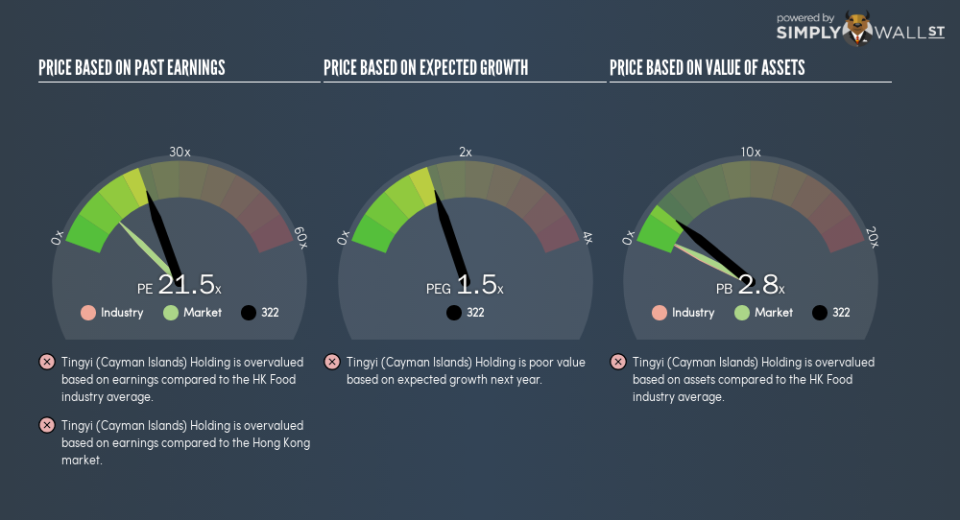
This article is written for those who want to get better at using price to earnings ratios (P/E ratios). We’ll show how you can use Tingyi (Cayman Islands) Holding Corp’s (HKG:322) P/E ratio to inform your assessment of the investment opportunity. Tingyi (Cayman Islands) Holding has a price to earnings ratio of 21.51, based on the last twelve months. That means that at current prices, buyers pay HK$21.51 for every HK$1 in trailing yearly profits.
Check out our latest analysis for Tingyi (Cayman Islands) Holding
How Do I Calculate Tingyi (Cayman Islands) Holding’s Price To Earnings Ratio?
The formula for P/E is:
Price to Earnings Ratio = Price per Share (in the reporting currency) ÷ Earnings per Share (EPS)
Or for Tingyi (Cayman Islands) Holding:
P/E of 21.51 = CN¥9.3 (Note: this is the share price in the reporting currency, namely, CNY ) ÷ CN¥0.43 (Based on the trailing twelve months to June 2018.)
Is A High Price-to-Earnings Ratio Good?
A higher P/E ratio implies that investors pay a higher price for the earning power of the business. That isn’t necessarily good or bad, but a high P/E implies relatively high expectations of what a company can achieve in the future.
How Growth Rates Impact P/E Ratios
Earnings growth rates have a big influence on P/E ratios. Earnings growth means that in the future the ‘E’ will be higher. That means unless the share price increases, the P/E will reduce in a few years. So while a stock may look expensive based on past earnings, it could be cheap based on future earnings.
Notably, Tingyi (Cayman Islands) Holding grew EPS by a whopping 72% in the last year. And its annual EPS growth rate over 3 years is 4.6%. So we’d generally expect it to have a relatively high P/E ratio. In contrast, EPS has decreased by 11%, annually, over 5 years.
How Does Tingyi (Cayman Islands) Holding’s P/E Ratio Compare To Its Peers?
The P/E ratio indicates whether the market has higher or lower expectations of a company. As you can see below, Tingyi (Cayman Islands) Holding has a higher P/E than the average company (10.7) in the food industry.
Tingyi (Cayman Islands) Holding’s P/E tells us that market participants think the company will perform better than its industry peers, going forward. Clearly the market expects growth, but it isn’t guaranteed. So investors should always consider the P/E ratio alongside other factors, such as whether company directors have been buying shares.
Remember: P/E Ratios Don’t Consider The Balance Sheet
The ‘Price’ in P/E reflects the market capitalization of the company. Thus, the metric does not reflect cash or debt held by the company. Hypothetically, a company could reduce its future P/E ratio by spending its cash (or taking on debt) to achieve higher earnings.
Spending on growth might be good or bad a few years later, but the point is that the P/E ratio does not account for the option (or lack thereof).
Is Debt Impacting Tingyi (Cayman Islands) Holding’s P/E?
Since Tingyi (Cayman Islands) Holding holds net cash of CN¥1.2b, it can spend on growth, justifying a higher P/E ratio than otherwise.
The Verdict On Tingyi (Cayman Islands) Holding’s P/E Ratio
Tingyi (Cayman Islands) Holding’s P/E is 21.5 which is above average (10.7) in the HK market. Its net cash position supports a higher P/E ratio, as does its solid recent earnings growth. So it is not surprising the market is probably extrapolating recent growth well into the future, reflected in the relatively high P/E ratio.
When the market is wrong about a stock, it gives savvy investors an opportunity. As value investor Benjamin Graham famously said, ‘In the short run, the market is a voting machine but in the long run, it is a weighing machine.’ So this free visual report on analyst forecasts could hold they key to an excellent investment decision.
Of course, you might find a fantastic investment by looking at a few good candidates. So take a peek at this free list of companies with modest (or no) debt, trading on a P/E below 20.
To help readers see past the short term volatility of the financial market, we aim to bring you a long-term focused research analysis purely driven by fundamental data. Note that our analysis does not factor in the latest price-sensitive company announcements.
The author is an independent contributor and at the time of publication had no position in the stocks mentioned. For errors that warrant correction please contact the editor at editorial-team@simplywallst.com.
