Did The Alumasc Group plc’s (LON:ALU) Recent Earnings Growth Beat The Trend?

When The Alumasc Group plc (LSE:ALU) released its most recent earnings update (30 June 2017), I compared it against two factor: its historical earnings track record, and the performance of its industry peers on average. Understanding how Alumasc Group performed requires a benchmark rather than trying to assess a standalone number at one point in time. Below is a quick commentary on how I see ALU has performed. View our latest analysis for Alumasc Group
How Did ALU’s Recent Performance Stack Up Against Its Past?
For the purpose of this commentary, I like to use data from the most recent 12 months, which either annualizes the most recent 6-month earnings update, or in some cases, the most recent annual report is already the latest available financial data. This technique enables me to assess different stocks on a similar basis, using the most relevant data points. For Alumasc Group, the latest twelve-month earnings is £6.5M, which, against last year’s level, has climbed up by 26.30%. Since these values are relatively nearsighted, I have computed an annualized five-year value for Alumasc Group’s earnings, which stands at £3.7M. This means on average, Alumasc Group has been able to gradually grow its earnings over the last few years as well.
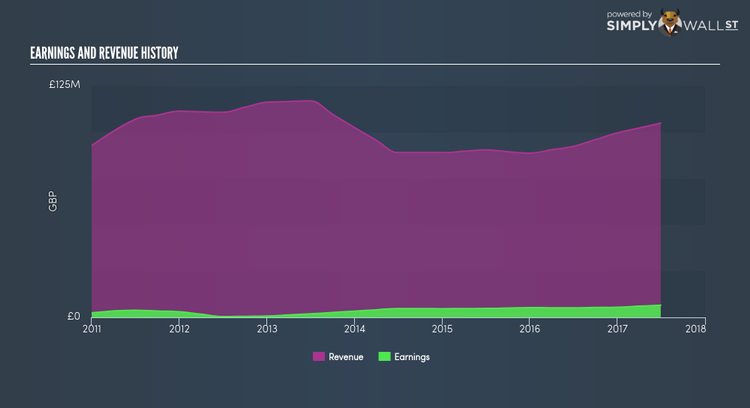
How has it been able to do this? Let’s take a look at if it is merely due to industry tailwinds, or if Alumasc Group has experienced some company-specific growth. Over the past few years, Alumasc Group increased bottom-line, while its top-line fell, by efficiently controlling its costs. This has caused to a margin expansion and profitability over time. Viewing growth from a sector-level, the UK building products industry has been growing, albeit, at a unexciting single-digit rate of 3.46% over the previous year, and a substantial 26.99% over the past couple of years. This suggests that whatever recent headwind the industry is experiencing, the impact on Alumasc Group has been softer relative to its peers.
What does this mean?
While past data is useful, it doesn’t tell the whole story. While Alumasc Group has a good historical track record with positive growth and profitability, there’s no certainty that this will extrapolate into the future. I suggest you continue to research Alumasc Group to get a better picture of the stock by looking at:
1. Future Outlook: What are well-informed industry analysts predicting for ALU’s future growth? Take a look at our free research report of analyst consensus for ALU’s outlook.
2. Financial Health: Is ALU’s operations financially sustainable? Balance sheets can be hard to analyze, which is why we’ve done it for you. Check out our financial health checks here.
3. Other High-Performing Stocks: Are there other stocks that provide better prospects with proven track records? Explore our free list of these great stocks here.
NB: Figures in this article are calculated using data from the last twelve months, which refer to the 12-month period ending on the last date of the month the financial statement is dated. This may not be consistent with full year annual report figures.
To help readers see pass the short term volatility of the financial market, we aim to bring you a long-term focused research analysis purely driven by fundamental data. Note that our analysis does not factor in the latest price sensitive company announcements.
The author is an independent contributor and at the time of publication had no position in the stocks mentioned.
