Did Biomass Energy Project SA. (WSE:BEP) Create Value For Investors Over The Past Year?

Biomass Energy Project SA. (WSE:BEP) delivered a less impressive 2.35% ROE over the past year, compared to the 9.45% return generated by its industry. Though BEP’s recent performance is underwhelming, it is useful to understand what ROE is made up of and how it should be interpreted. Knowing these components can change your views on BEP’s below-average returns. Today I will look at how components such as financial leverage can influence ROE which may impact the sustainability of BEP’s returns. Check out our latest analysis for Biomass Energy Project
What you must know about ROE
Return on Equity (ROE) weighs Biomass Energy Project’s profit against the level of its shareholders’ equity. For example, if the company invests PLN1 in the form of equity, it will generate PLN0.02 in earnings from this. In most cases, a higher ROE is preferred; however, there are many other factors we must consider prior to making any investment decisions.
Return on Equity = Net Profit ÷ Shareholders Equity
ROE is assessed against cost of equity, which is measured using the Capital Asset Pricing Model (CAPM) – but let’s not dive into the details of that today. For now, let’s just look at the cost of equity number for Biomass Energy Project, which is 8.67%. This means Biomass Energy Project’s returns actually do not cover its own cost of equity, with a discrepancy of -6.31%. This isn’t sustainable as it implies, very simply, that the company pays more for its capital than what it generates in return. ROE can be dissected into three distinct ratios: net profit margin, asset turnover, and financial leverage. This is called the Dupont Formula:
Dupont Formula
ROE = profit margin × asset turnover × financial leverage
ROE = (annual net profit ÷ sales) × (sales ÷ assets) × (assets ÷ shareholders’ equity)
ROE = annual net profit ÷ shareholders’ equity

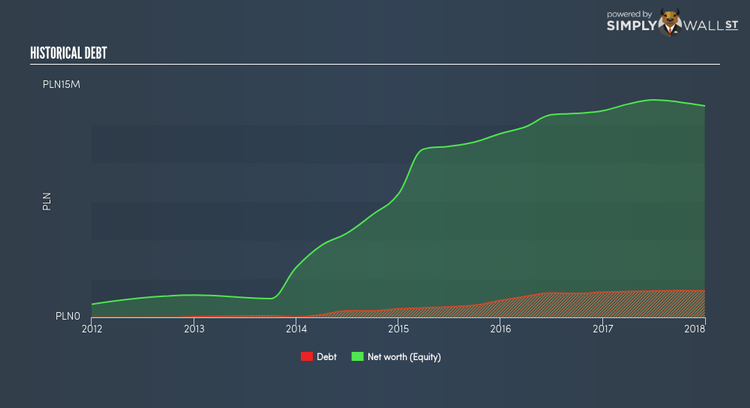
Basically, profit margin measures how much of revenue trickles down into earnings which illustrates how efficient the business is with its cost management. The other component, asset turnover, illustrates how much revenue Biomass Energy Project can make from its asset base. The most interesting ratio, and reflective of sustainability of its ROE, is financial leverage. Since financial leverage can artificially inflate ROE, we need to look at how much debt Biomass Energy Project currently has. At 12.56%, Biomass Energy Project’s debt-to-equity ratio appears low and indicates that Biomass Energy Project still has room to increase leverage and grow its profits.
Next Steps:
ROE is one of many ratios which meaningfully dissects financial statements, which illustrates the quality of a company. Biomass Energy Project exhibits a weak ROE against its peers, as well as insufficient levels to cover its own cost of equity this year. However, ROE is not likely to be inflated by excessive debt funding, giving shareholders more conviction in the sustainability of returns, which has headroom to increase further. Although ROE can be a useful metric, it is only a small part of diligent research.
For Biomass Energy Project, there are three key factors you should further research:
Financial Health: Does it have a healthy balance sheet? Take a look at our free balance sheet analysis with six simple checks on key factors like leverage and risk.
Future Earnings: How does Biomass Energy Project’s growth rate compare to its peers and the wider market? Dig deeper into the analyst consensus number for the upcoming years by interacting with our free analyst growth expectation chart.
Other High-Growth Alternatives : Are there other high-growth stocks you could be holding instead of Biomass Energy Project? Explore our interactive list of stocks with large growth potential to get an idea of what else is out there you may be missing!
To help readers see pass the short term volatility of the financial market, we aim to bring you a long-term focused research analysis purely driven by fundamental data. Note that our analysis does not factor in the latest price sensitive company announcements.
The author is an independent contributor and at the time of publication had no position in the stocks mentioned.
