How Did China Eastern Airlines Corporation Limited’s (HKG:670) 11.11% ROE Fare Against The Industry?

China Eastern Airlines Corporation Limited (SEHK:670) generated a below-average return on equity of 11.11% in the past 12 months, while its industry returned 19.42%. 670’s results could indicate a relatively inefficient operation to its peers, and while this may be the case, it is important to understand what ROE is made up of and how it should be interpreted. Knowing these components could change your view on 670’s performance. Metrics such as financial leverage can impact the level of ROE which in turn can affect the sustainability of 670’s returns. Let me show you what I mean by this. View our latest analysis for China Eastern Airlines
What you must know about ROE
Firstly, Return on Equity, or ROE, is simply the percentage of last years’ earning against the book value of shareholders’ equity. For example, if the company invests HK$1 in the form of equity, it will generate HK$0.11 in earnings from this. In most cases, a higher ROE is preferred; however, there are many other factors we must consider prior to making any investment decisions.
Return on Equity = Net Profit ÷ Shareholders Equity
ROE is assessed against cost of equity, which is measured using the Capital Asset Pricing Model (CAPM) – but let’s not dive into the details of that today. For now, let’s just look at the cost of equity number for China Eastern Airlines, which is 11.61%. Given a discrepancy of -0.005% between return and cost, this indicated that China Eastern Airlines may be paying more for its capital than what it’s generating in return. ROE can be split up into three useful ratios: net profit margin, asset turnover, and financial leverage. This is called the Dupont Formula:
Dupont Formula
ROE = profit margin × asset turnover × financial leverage
ROE = (annual net profit ÷ sales) × (sales ÷ assets) × (assets ÷ shareholders’ equity)
ROE = annual net profit ÷ shareholders’ equity

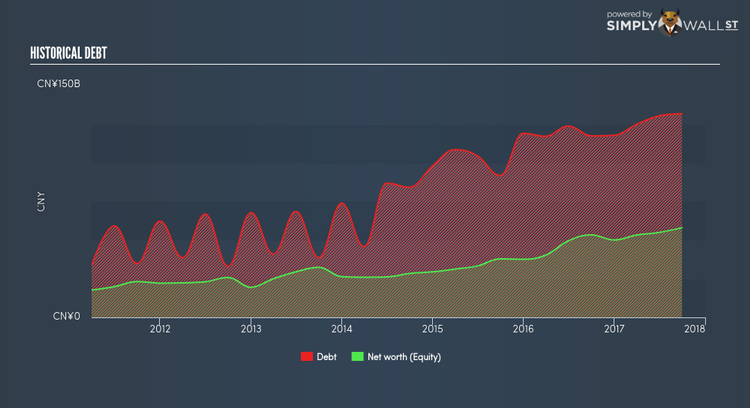
The first component is profit margin, which measures how much of sales is retained after the company pays for all its expenses. Asset turnover reveals how much revenue can be generated from China Eastern Airlines’s asset base. The most interesting ratio, and reflective of sustainability of its ROE, is financial leverage. Since ROE can be artificially increased through excessive borrowing, we should check China Eastern Airlines’s historic debt-to-equity ratio. Currently the debt-to-equity ratio stands at a high 227.03%, which means its below-average ROE is already being driven by significant debt levels.
Next Steps:
While ROE is a relatively simple calculation, it can be broken down into different ratios, each telling a different story about the strengths and weaknesses of a company. China Eastern Airlines exhibits a weak ROE against its peers, as well as insufficient levels to cover its own cost of equity this year. Although, its appropriate level of leverage means investors can be more confident in the sustainability of China Eastern Airlines’s return with a possible increase should the company decide to increase its debt levels. ROE is a helpful signal, but it is definitely not sufficient on its own to make an investment decision.
For China Eastern Airlines, I’ve compiled three essential factors you should look at:
1. Financial Health: Does it have a healthy balance sheet? Take a look at our free balance sheet analysis with six simple checks on key factors like leverage and risk.
2. Management:Have insiders been ramping up their shares to take advantage of the market’s sentiment for China Eastern Airlines’s future outlook? Check out our management and board analysis with insights on CEO compensation and governance factors.
3. Other High-Growth Alternatives : Are there other high-growth stocks you could be holding instead of China Eastern Airlines? Explore our interactive list of stocks with large growth potential to get an idea of what else is out there you may be missing!
To help readers see pass the short term volatility of the financial market, we aim to bring you a long-term focused research analysis purely driven by fundamental data. Note that our analysis does not factor in the latest price sensitive company announcements.
The author is an independent contributor and at the time of publication had no position in the stocks mentioned.
