Did Insiders Buy On Sandfire Resources NL’s (ASX:SFR) Price Volatility?

Sandfire Resources NL engages in the exploration and evaluation of the mineral tenements in Australia and internationally. Sandfire Resources is one of Australia’s some insider buying over the past three months, with insiders investing in more than 8 million shares during this period. Generally, insiders buying more shares in their own firm sends a bullish signal. A two-decade research published in The MIT Press (1998) showed that stocks following insider buying outperformed the market by 4.5%. But these signals may not be sufficient to gain confidence on whether to invest. Today we will evaluate whether these decisions are bolstered by analysts’ expectations of future growth as well as recent share price movements.
View our latest analysis for Sandfire Resources
Who Are The Insiders?
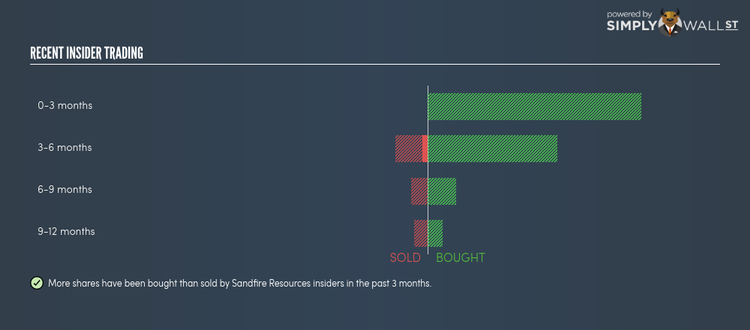
More shares have been bought than sold by Sandfire Resources insiders in the past three months. In total, individual insiders own over 5 million shares in the business, which makes up around 3.47% of total shares outstanding. .
The entity that bought on the open market in the last three months was
LSV Asset Management Morgan Stanley Investment Management Inc. Morgan Stanley Investment Banking and Brokerage Investments. Although this is an institutional investor, rather than a company executive or board member, the insights gained from direct access to management as a large investor would make it more well-informed than the average retail investor. In this specific instance, I would classify this investor as a company insider.
Does Buying Activity Reflect Future Growth?
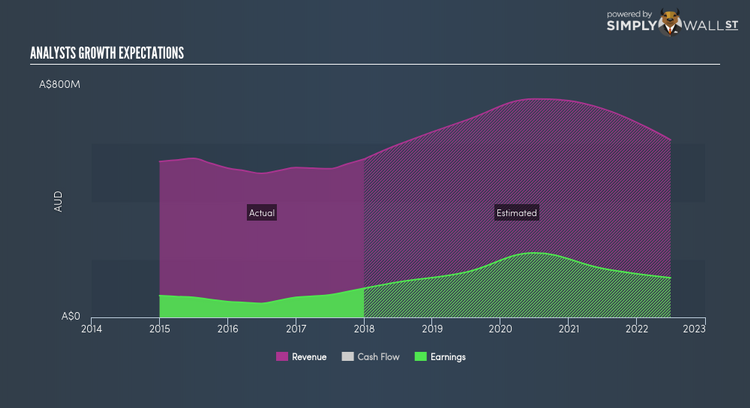
At first glance, analysts’ earnings expectations of 112.03% over the next three years illustrates a very optimistic outlook for the business which is consistent with the signal company insiders are sending with their net buying activity. Digging deeper into the line items,analysts anticipate a healthy double-digit top-line growth next year, which seems to drive higher expected earnings growth as well. This could indicate significant cost-cutting activities or a high degree of economies of scale which may have a compounding impact in the future. If insiders recognised this, a signal of their confidence may be their higher shareholdings in the company. Or they may simply view the share price is currently too low compared to the share’s intrinsic value.
Did Stock Price Volatility Instigate Buying?
An alternative reason for recent trades could be insiders taking advantage of the share price volatility. Volatility provides an opportunity to trade on market inefficiencies when the stock is under-priced compared to the stock’s intrinsic value. Sandfire Resources’s shares ranged between A$8.48 and A$6.85 over the past three months. This indicates moderate volatility with a share price movement of 23.72%. Perhaps not a significant enough movement to warrant transactions, thus motivation may be a result of their belief in the company in the future or simply personal portfolio rebalancing.
Next Steps:
Sandfire Resources’s insider meaningful buying activity tells us the shares are currently in favour, which is consistent with the significant expected earnings growth, even if the low share price volatility did not warrant exploiting any mispricing. However, while insider transactions could be a helpful signal, it is definitely not sufficient on its own to make an investment decision. there are two key aspects you should further examine:
Financial Health: Does Sandfire Resources have a healthy balance sheet? Take a look at our free balance sheet analysis with six simple checks on key factors like leverage and risk.
Other High Quality Alternatives : Are there other high quality stocks you could be holding instead of Sandfire Resources? Explore our interactive list of high quality stocks to get an idea of what else is out there you may be missing!
NB: Figures in this article are calculated using data from the last twelve months, which refer to the 12-month period ending on the last date of the month the financial statement is dated. This may not be consistent with full year annual report figures.
To help readers see pass the short term volatility of the financial market, we aim to bring you a long-term focused research analysis purely driven by fundamental data. Note that our analysis does not factor in the latest price sensitive company announcements.
The author is an independent contributor and at the time of publication had no position in the stocks mentioned.
