Did Just Energy Group Inc (TSE:JE) Create Value For Shareholders?

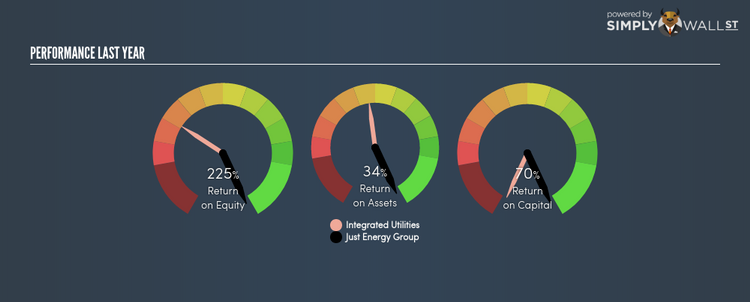
Just Energy Group Inc (TSX:JE) delivered an ROE of 224.74% over the past 12 months, which is an impressive feat relative to its industry average of 6.88% during the same period. On the surface, this looks fantastic since we know that JE has made large profits from little equity capital; however, ROE doesn’t tell us if management have borrowed heavily to make this happen. We’ll take a closer look today at factors like financial leverage to determine whether JE’s ROE is actually sustainable. Check out our latest analysis for Just Energy Group
Breaking down ROE — the mother of all ratios
Return on Equity (ROE) is a measure of Just Energy Group’s profit relative to its shareholders’ equity. It essentially shows how much the company can generate in earnings given the amount of equity it has raised. In most cases, a higher ROE is preferred; however, there are many other factors we must consider prior to making any investment decisions.
Return on Equity = Net Profit ÷ Shareholders Equity
ROE is assessed against cost of equity, which is measured using the Capital Asset Pricing Model (CAPM) – but let’s not dive into the details of that today. For now, let’s just look at the cost of equity number for Just Energy Group, which is 8.47%. This means Just Energy Group returns enough to cover its own cost of equity, with a buffer of 216.27%. This sustainable practice implies that the company pays less for its capital than what it generates in return. ROE can be broken down into three different ratios: net profit margin, asset turnover, and financial leverage. This is called the Dupont Formula:
Dupont Formula
ROE = profit margin × asset turnover × financial leverage
ROE = (annual net profit ÷ sales) × (sales ÷ assets) × (assets ÷ shareholders’ equity)
ROE = annual net profit ÷ shareholders’ equity
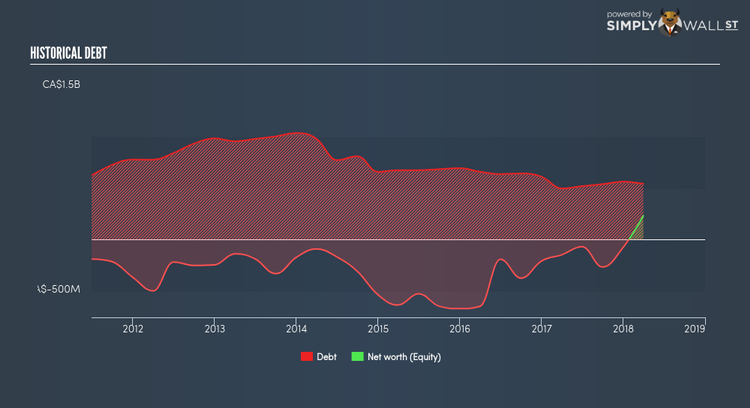
Basically, profit margin measures how much of revenue trickles down into earnings which illustrates how efficient the business is with its cost management. The other component, asset turnover, illustrates how much revenue Just Energy Group can make from its asset base. And finally, financial leverage is simply how much of assets are funded by equity, which exhibits how sustainable the company’s capital structure is. Since ROE can be artificially increased through excessive borrowing, we should check Just Energy Group’s historic debt-to-equity ratio. At 235.55%, Just Energy Group’s debt-to-equity ratio appears relatively high and indicates the above-average ROE is generated by significant leverage levels.
Next Steps:
ROE is a simple yet informative ratio, illustrating the various components that each measure the quality of the overall stock. Just Energy Group’s above-industry ROE is encouraging, and is also in excess of its cost of equity. Its high debt level means its strong ROE may be driven by debt funding which raises concerns over the sustainability of Just Energy Group’s returns. ROE is a helpful signal, but it is definitely not sufficient on its own to make an investment decision.
For Just Energy Group, I’ve compiled three fundamental aspects you should further examine:
Financial Health: Does it have a healthy balance sheet? Take a look at our free balance sheet analysis with six simple checks on key factors like leverage and risk.
Valuation: What is Just Energy Group worth today? Is the stock undervalued, even when its growth outlook is factored into its intrinsic value? The intrinsic value infographic in our free research report helps visualize whether Just Energy Group is currently mispriced by the market.
Other High-Growth Alternatives : Are there other high-growth stocks you could be holding instead of Just Energy Group? Explore our interactive list of stocks with large growth potential to get an idea of what else is out there you may be missing!
To help readers see pass the short term volatility of the financial market, we aim to bring you a long-term focused research analysis purely driven by fundamental data. Note that our analysis does not factor in the latest price sensitive company announcements.
The author is an independent contributor and at the time of publication had no position in the stocks mentioned.
