How Did Northrop Grumman Corporation’s (NYSE:NOC) 28.59% ROE Fare Against The Industry?

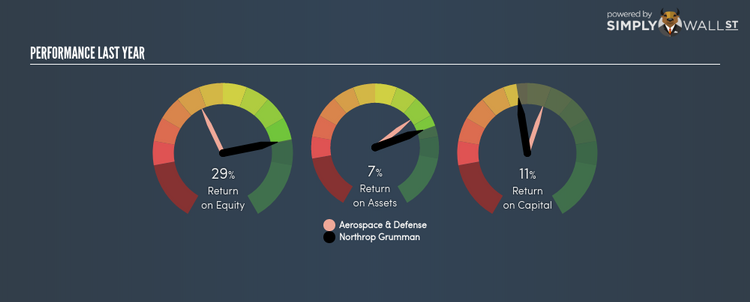
Northrop Grumman Corporation (NYSE:NOC) outperformed the Aerospace and Defense industry on the basis of its ROE – producing a higher 28.59% relative to the peer average of 11.93% over the past 12 months. On the surface, this looks fantastic since we know that NOC has made large profits from little equity capital; however, ROE doesn’t tell us if management have borrowed heavily to make this happen. In this article, we’ll closely examine some factors like financial leverage to evaluate the sustainability of NOC’s ROE. View our latest analysis for Northrop Grumman
Breaking down ROE — the mother of all ratios
Return on Equity (ROE) weighs Northrop Grumman’s profit against the level of its shareholders’ equity. For example, if the company invests $1 in the form of equity, it will generate $0.29 in earnings from this. While a higher ROE is preferred in most cases, there are several other factors we should consider before drawing any conclusions.
Return on Equity = Net Profit ÷ Shareholders Equity
ROE is measured against cost of equity in order to determine the efficiency of Northrop Grumman’s equity capital deployed. Its cost of equity is 9.18%. Since Northrop Grumman’s return covers its cost in excess of 19.41%, its use of equity capital is efficient and likely to be sustainable. Simply put, Northrop Grumman pays less for its capital than what it generates in return. ROE can be broken down into three different ratios: net profit margin, asset turnover, and financial leverage. This is called the Dupont Formula:
Dupont Formula
ROE = profit margin × asset turnover × financial leverage
ROE = (annual net profit ÷ sales) × (sales ÷ assets) × (assets ÷ shareholders’ equity)
ROE = annual net profit ÷ shareholders’ equity
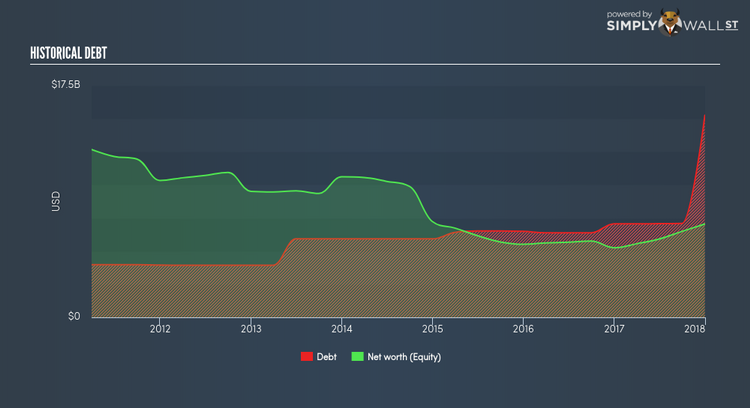
The first component is profit margin, which measures how much of sales is retained after the company pays for all its expenses. The other component, asset turnover, illustrates how much revenue Northrop Grumman can make from its asset base. And finally, financial leverage is simply how much of assets are funded by equity, which exhibits how sustainable the company’s capital structure is. Since financial leverage can artificially inflate ROE, we need to look at how much debt Northrop Grumman currently has. Currently the debt-to-equity ratio stands at a high 216.60%, which means its above-average ROE is driven by significant debt levels.
Next Steps:
ROE is a simple yet informative ratio, illustrating the various components that each measure the quality of the overall stock. Northrop Grumman’s ROE is impressive relative to the industry average and also covers its cost of equity. Its high debt level means its strong ROE may be driven by debt funding which raises concerns over the sustainability of Northrop Grumman’s returns. Although ROE can be a useful metric, it is only a small part of diligent research.
For Northrop Grumman, I’ve put together three pertinent factors you should look at:
1. Financial Health: Does it have a healthy balance sheet? Take a look at our free balance sheet analysis with six simple checks on key factors like leverage and risk.
2. Valuation: What is Northrop Grumman worth today? Is the stock undervalued, even when its growth outlook is factored into its intrinsic value? The intrinsic value infographic in our free research report helps visualize whether Northrop Grumman is currently mispriced by the market.
3. Other High-Growth Alternatives : Are there other high-growth stocks you could be holding instead of Northrop Grumman? Explore our interactive list of stocks with large growth potential to get an idea of what else is out there you may be missing!
To help readers see pass the short term volatility of the financial market, we aim to bring you a long-term focused research analysis purely driven by fundamental data. Note that our analysis does not factor in the latest price sensitive company announcements.
The author is an independent contributor and at the time of publication had no position in the stocks mentioned.
