How Did Sphere 3D Corp’s (NASDAQ:ANY) Earnings Growth Stack Up Against The Industry?

Increase in profitability and industry-beating performance can be essential considerations in a stock for some investors. In this article, I will take a look at Sphere 3D Corp’s (NASDAQ:ANY) track record on a high level, to give you some insight into how the company has been performing against its historical trend and its industry peers. Check out our latest analysis for Sphere 3D
Commentary On ANY’s Past Performance
For the most up-to-date info, I use data from the most recent 12 months, which annualizes the latest 6-month earnings release, or some times, the latest annual report is already the most recent financial data. This technique allows me to examine various companies on a similar basis, using the most relevant data points. For Sphere 3D, its latest trailing-twelve-month earnings is -US$26.29M, which compared to the previous year’s figure, has become less negative. Given that these figures may be somewhat nearsighted, I’ve estimated an annualized five-year figure for Sphere 3D’s earnings, which stands at -US$26.31M. This shows that, although net income is negative, it has become less negative over the years.
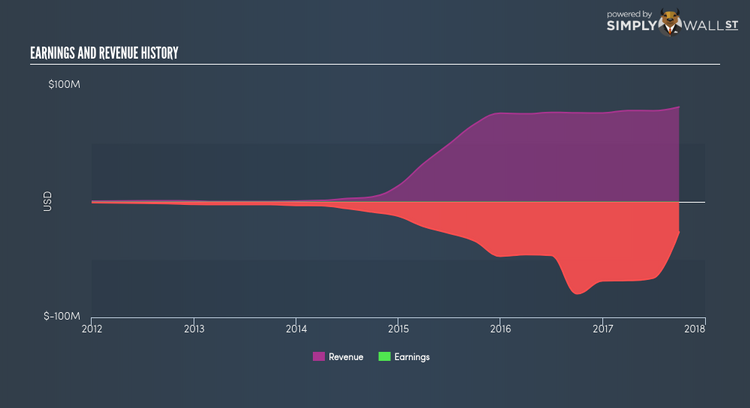
We can further examine Sphere 3D’s loss by looking at what the industry has been experiencing over the past few years. Each year, for the past five years Sphere 3D’s top-line has risen by 52.42% on average, indicating that the company is in a high-growth phase with expenses racing ahead revenues, leading to annual losses. Inspecting growth from a sector-level, the US software industry has been growing, albeit, at a subdued single-digit rate of 9.84% over the past twelve months, and a substantial 11.81% over the past five. This suggests that, even though Sphere 3D is currently loss-making, it may have benefited from industry tailwinds, moving earnings into a more favorable position.
What does this mean?
Sphere 3D’s track record can be a valuable insight into its earnings performance, but it certainly doesn’t tell the whole story. With companies that are currently loss-making, it is always difficult to predict what will happen in the future and when. The most valuable step is to assess company-specific issues Sphere 3D may be facing and whether management guidance has dependably been met in the past. You should continue to research Sphere 3D to get a more holistic view of the stock by looking at the areas below. Just a heads up – to access some parts of the Simply Wall St research tool you might be asked to create a free account, but it takes just one click and the information they provide is definitely worth it in my opinion.
1. Financial Health: Is ANY’s operations financially sustainable? Balance sheets can be hard to analyze, which is why Simply Wall St does it for you. Check out important financial health checks here.
2. Valuation: What is ANY worth today? Is the stock undervalued, even when its growth outlook is factored into its intrinsic value? The intrinsic value infographic in this free research report helps visualize whether ANY is currently mispriced by the market.
3. Other High-Performing Stocks: Are there other stocks that provide better prospects with proven track records? Explore a free list of these great stocks here.
NB: Figures in this article are calculated using data from the trailing twelve months from 30 September 2017. This may not be consistent with full year annual report figures.
To help readers see pass the short term volatility of the financial market, we aim to bring you a long-term focused research analysis purely driven by fundamental data. Note that our analysis does not factor in the latest price sensitive company announcements.
The author is an independent contributor and at the time of publication had no position in the stocks mentioned.
