How Did Star Gas Partners LP’s (SGU) 7.67% ROE Fare Against The Industry?

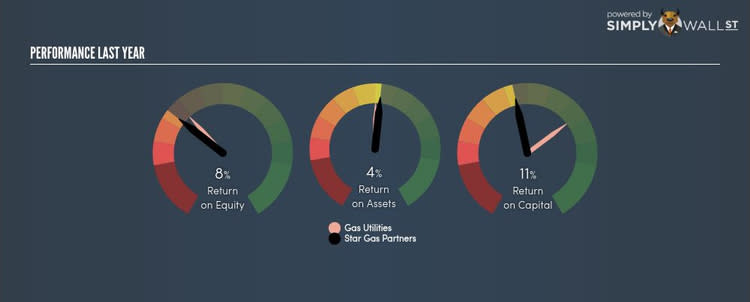
Star Gas Partners LP (NYSE:SGU) generated a below-average return on equity of 7.67% in the past 12 months, while its industry returned 9.18%. SGU’s results could indicate a relatively inefficient operation to its peers, and while this may be the case, it is important to understand what ROE is made up of and how it should be interpreted. Knowing these components could change your view on SGU’s performance. Today I will look at how components such as financial leverage can influence ROE which may impact the sustainability of SGU’s returns. View our latest analysis for Star Gas Partners
Breaking down Return on Equity
Return on Equity (ROE) is a measure of SGU’s profit relative to its shareholders’ equity. For example, if SGU invests $1 in the form of equity, it will generate $0.08 in earnings from this. While a higher ROE is preferred in most cases, there are several other factors we should consider before drawing any conclusions.
Return on Equity = Net Profit ÷ Shareholders Equity
ROE is assessed against cost of equity, which is measured using the Capital Asset Pricing Model (CAPM) – but let’s not dive into the details of that today. For now, let’s just look at the cost of equity number for SGU, which is 8.49%. This means SGU’s returns actually do not cover its own cost of equity, with a discrepancy of -0.82%. This isn’t sustainable as it implies, very simply, that the company pays more for its capital than what it generates in return. ROE can be broken down into three different ratios: net profit margin, asset turnover, and financial leverage. This is called the Dupont Formula:
Dupont Formula
ROE = profit margin × asset turnover × financial leverage
ROE = (annual net profit ÷ sales) × (sales ÷ assets) × (assets ÷ shareholders’ equity)
ROE = annual net profit ÷ shareholders’ equity
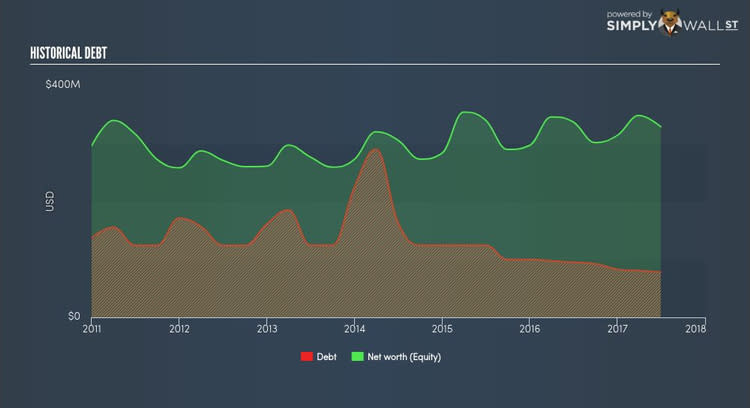
The first component is profit margin, which measures how much of sales is retained after the company pays for all its expenses. Asset turnover reveals how much revenue can be generated from SGU’s asset base. Finally, financial leverage will be our main focus today. It shows how much of assets are funded by equity and can show how sustainable SGU’s capital structure is. Since ROE can be artificially increased through excessive borrowing, we should check SGU’s historic debt-to-equity ratio. At 23.75%, SGU’s debt-to-equity ratio appears low and indicates that SGU still has room to increase leverage and grow its profits.
What this means for you:
Are you a shareholder? SGU exhibits a weak ROE against its peers, as well as insufficient levels to cover its own cost of equity this year. However, investors shouldn’t despair since ROE is not inflated by excessive debt, which means SGU still has room to improve shareholder returns by raising debt to fund new investments. If you’re looking for new ideas for high-returning stocks, you should take a look at our free platform to see the list of stocks with Return on Equity over 20%.
Are you a potential investor? If SGU has been on your watch list for a while, making an investment decision based on ROE alone is unwise. I recommend you do additional fundamental analysis by looking through our most recent infographic report on Star Gas Partners to help you make a more informed investment decision.
To help readers see pass the short term volatility of the financial market, we aim to bring you a long-term focused research analysis purely driven by fundamental data. Note that our analysis does not factor in the latest price sensitive company announcements.
The author is an independent contributor and at the time of publication had no position in the stocks mentioned.
