Are Dividend Investors Getting More Than They Bargained For With AWF Madison Group Limited's (NZSE:AWF) Dividend?

Want to participate in a short research study? Help shape the future of investing tools and you could win a $250 gift card!
Is AWF Madison Group Limited (NZSE:AWF) a good dividend stock? How would you know? Dividend paying companies with growing earnings can be highly rewarding in the long term. Yet sometimes, investors buy a stock for its dividend and lose money because the share price falls by more than they earned in dividend payments.
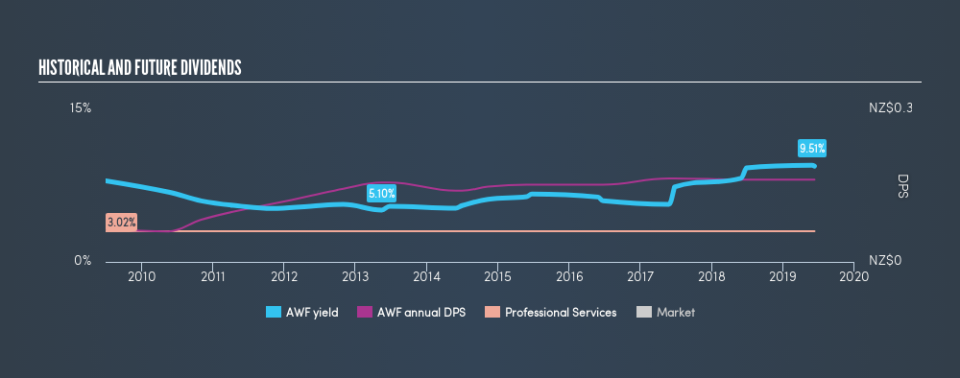
In this case, AWF Madison Group likely looks attractive to investors, given its 9.4% dividend yield and a payment history of over ten years. We'd guess that plenty of investors have purchased it for the income. Some simple analysis can offer a lot of insights when buying a company for its dividend, and we'll go through this below.
Click the interactive chart for our full dividend analysis
Payout ratios
Companies (usually) pay dividends out of their earnings. If a company is paying more than it earns, the dividend might have to be cut. So we need to form a view on if a company's dividend is sustainable, relative to its net profit after tax. In the last year, AWF Madison Group paid out 266% of its profit as dividends. Unless there are extenuating circumstances, from the perspective of an investor who hopes to own the company for many years, a payout ratio of above 100% is definitely a concern.
In addition to comparing dividends against profits, we should inspect whether the company generated enough cash to pay its dividend. AWF Madison Group paid out 72% of its cash flow as dividends last year, which is within a reasonable range for the average corporation. It's disappointing to see that the dividend was not covered by profits, but cash is more important from a dividend sustainability perspective, and AWF Madison Group fortunately did generate enough cash to fund its dividend. Still, if the company repeatedly paid a dividend greater than its profits, we'd be concerned. Very few companies are able to sustainably pay dividends larger than their reported earnings.
Is AWF Madison Group's Balance Sheet Risky?
As AWF Madison Group's dividend was not well covered by earnings, we need to check its balance sheet for signs of financial distress. A rough way to check this is with these two simple ratios: a) net debt divided by EBITDA (earnings before interest, tax, depreciation and amortisation), and b) net interest cover. Net debt to EBITDA is a measure of a company's total debt. Net interest cover measures the ability to meet interest payments on debt. Essentially we check that a) a company does not have too much debt, and b) that it can afford to pay the interest. AWF Madison Group has net debt of more than 3x its EBITDA, which is getting towards the limit of most investors' comfort zones. Judicious use of debt can enhance shareholder returns, but also adds to the risk if something goes awry.
We calculated its interest cover by measuring its earnings before interest and tax (EBIT), and dividing this by the company's net interest expense. Interest cover of less than 5x its interest expense is starting to become a concern for AWF Madison Group, and be aware that lenders may place additional restrictions on the company as well.
Remember, you can always get a snapshot of AWF Madison Group's latest financial position, by checking our visualisation of its financial health.
Dividend Volatility
From the perspective of an income investor who wants to earn dividends for many years, there is not much point buying a stock if its dividend is regularly cut or is not reliable. AWF Madison Group has been paying dividends for a long time, but for the purpose of this analysis, we only examine the past 10 years of payments. During this period the dividend has been stable, which could imply the business could have relatively consistent earnings power. During the past ten-year period, the first annual payment was NZ$0.065 in 2009, compared to NZ$0.16 last year. This works out to be a compound annual growth rate (CAGR) of approximately 9.6% a year over that time.
Companies like this, growing their dividend at a decent rate, can be very valuable over the long term, if the rate of growth can be maintained.
Dividend Growth Potential
Dividend payments have been consistent over the past few years, but we should always check if earnings per share (EPS) are growing, as this will help maintain the purchasing power of the dividend. Over the past five years, it looks as though AWF Madison Group's EPS have declined at around 17% a year. Declining earnings per share over a number of years is not a great sign for the dividend investor. Without some improvement, this does not bode well for the long term value of a company's dividend.
We'd also point out that AWF Madison Group issued a meaningful number of new shares in the past year. Trying to grow the dividend when issuing new shares reminds us of the ancient Greek tale of Sisyphus - perpetually pushing a boulder uphill. Companies that consistently issue new shares are often suboptimal from a dividend perspective.
Conclusion
To summarise, shareholders should always check that AWF Madison Group's dividends are affordable, that its dividend payments are relatively stable, and that it has decent prospects for growing its earnings and dividend. We're a bit uncomfortable with its high payout ratio, although at least the dividend was covered by free cash flow. Second, earnings per share have actually shrunk, but at least the dividends have been relatively stable. In summary, AWF Madison Group has a number of shortcomings that we'd find it hard to get past. Things could change, but we think there are a number of better ideas out there.
Now, if you want to look closer, it would be worth checking out our free research on AWF Madison Group management tenure, salary, and performance.
If you are a dividend investor, you might also want to look at our curated list of dividend stocks yielding above 3%.
We aim to bring you long-term focused research analysis driven by fundamental data. Note that our analysis may not factor in the latest price-sensitive company announcements or qualitative material.
If you spot an error that warrants correction, please contact the editor at editorial-team@simplywallst.com. This article by Simply Wall St is general in nature. It does not constitute a recommendation to buy or sell any stock, and does not take account of your objectives, or your financial situation. Simply Wall St has no position in the stocks mentioned. Thank you for reading.
