How Does Aalberts's (AMS:AALB) P/E Compare To Its Industry, After The Share Price Drop?

To the annoyance of some shareholders, Aalberts (AMS:AALB) shares are down a considerable 57% in the last month. That drop has capped off a tough year for shareholders, with the share price down 43% in that time.
Assuming nothing else has changed, a lower share price makes a stock more attractive to potential buyers. In the long term, share prices tend to follow earnings per share, but in the short term prices bounce around in response to short term factors (which are not always obvious). The implication here is that long term investors have an opportunity when expectations of a company are too low. Perhaps the simplest way to get a read on investors' expectations of a business is to look at its Price to Earnings Ratio (PE Ratio). Investors have optimistic expectations of companies with higher P/E ratios, compared to companies with lower P/E ratios.
Check out our latest analysis for Aalberts
How Does Aalberts's P/E Ratio Compare To Its Peers?
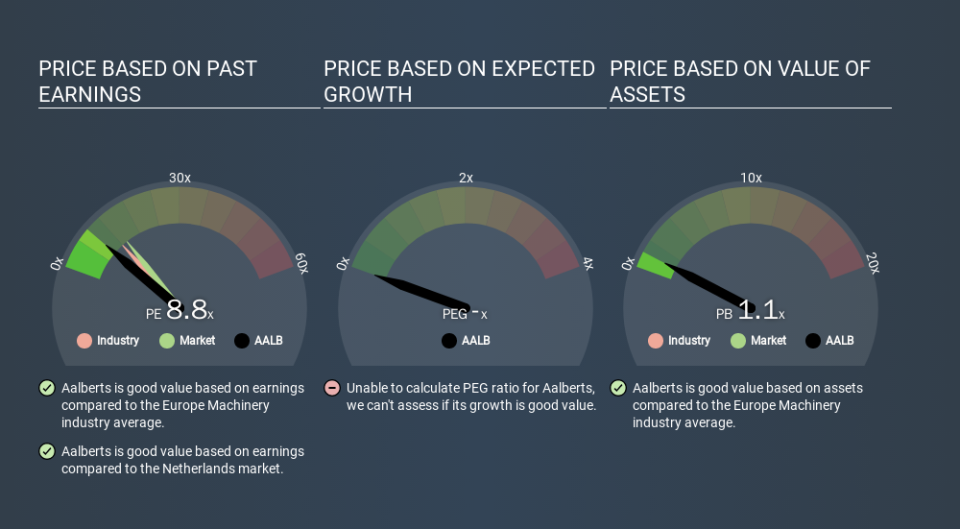
Aalberts's P/E of 8.84 indicates relatively low sentiment towards the stock. If you look at the image below, you can see Aalberts has a lower P/E than the average (12.0) in the machinery industry classification.
Aalberts's P/E tells us that market participants think it will not fare as well as its peers in the same industry. While current expectations are low, the stock could be undervalued if the situation is better than the market assumes. You should delve deeper. I like to check if company insiders have been buying or selling.
How Growth Rates Impact P/E Ratios
Probably the most important factor in determining what P/E a company trades on is the earnings growth. That's because companies that grow earnings per share quickly will rapidly increase the 'E' in the equation. Therefore, even if you pay a high multiple of earnings now, that multiple will become lower in the future. So while a stock may look expensive based on past earnings, it could be cheap based on future earnings.
Aalberts shrunk earnings per share by 5.2% last year. But over the longer term (5 years) earnings per share have increased by 8.9%.
Remember: P/E Ratios Don't Consider The Balance Sheet
The 'Price' in P/E reflects the market capitalization of the company. That means it doesn't take debt or cash into account. Theoretically, a business can improve its earnings (and produce a lower P/E in the future) by investing in growth. That means taking on debt (or spending its cash).
Spending on growth might be good or bad a few years later, but the point is that the P/E ratio does not account for the option (or lack thereof).
Is Debt Impacting Aalberts's P/E?
Aalberts has net debt equal to 29% of its market cap. While it's worth keeping this in mind, it isn't a worry.
The Verdict On Aalberts's P/E Ratio
Aalberts trades on a P/E ratio of 8.8, which is below the NL market average of 14.5. With only modest debt, it's likely the lack of EPS growth at least partially explains the pessimism implied by the P/E ratio. Given Aalberts's P/E ratio has declined from 20.7 to 8.8 in the last month, we know for sure that the market is more worried about the business today, than it was back then. For those who prefer to invest with the flow of momentum, that might be a bad sign, but for deep value investors this stock might justify some research.
Investors should be looking to buy stocks that the market is wrong about. If it is underestimating a company, investors can make money by buying and holding the shares until the market corrects itself. So this free visualization of the analyst consensus on future earnings could help you make the right decision about whether to buy, sell, or hold.
Of course you might be able to find a better stock than Aalberts. So you may wish to see this free collection of other companies that have grown earnings strongly.
If you spot an error that warrants correction, please contact the editor at editorial-team@simplywallst.com. This article by Simply Wall St is general in nature. It does not constitute a recommendation to buy or sell any stock, and does not take account of your objectives, or your financial situation. Simply Wall St has no position in the stocks mentioned.
We aim to bring you long-term focused research analysis driven by fundamental data. Note that our analysis may not factor in the latest price-sensitive company announcements or qualitative material. Thank you for reading.
