How Does AB Electrolux's (STO:ELUX B) P/E Compare To Its Industry, After The Share Price Drop?

Unfortunately for some shareholders, the AB Electrolux (STO:ELUX B) share price has dived 32% in the last thirty days. Indeed the recent decline has arguably caused some bitterness for shareholders who have held through the 37% drop over twelve months.
Assuming nothing else has changed, a lower share price makes a stock more attractive to potential buyers. In the long term, share prices tend to follow earnings per share, but in the short term prices bounce around in response to short term factors (which are not always obvious). So, on certain occasions, long term focussed investors try to take advantage of pessimistic expectations to buy shares at a better price. One way to gauge market expectations of a stock is to look at its Price to Earnings Ratio (PE Ratio). A high P/E ratio means that investors have a high expectation about future growth, while a low P/E ratio means they have low expectations about future growth.
View our latest analysis for AB Electrolux
How Does AB Electrolux's P/E Ratio Compare To Its Peers?
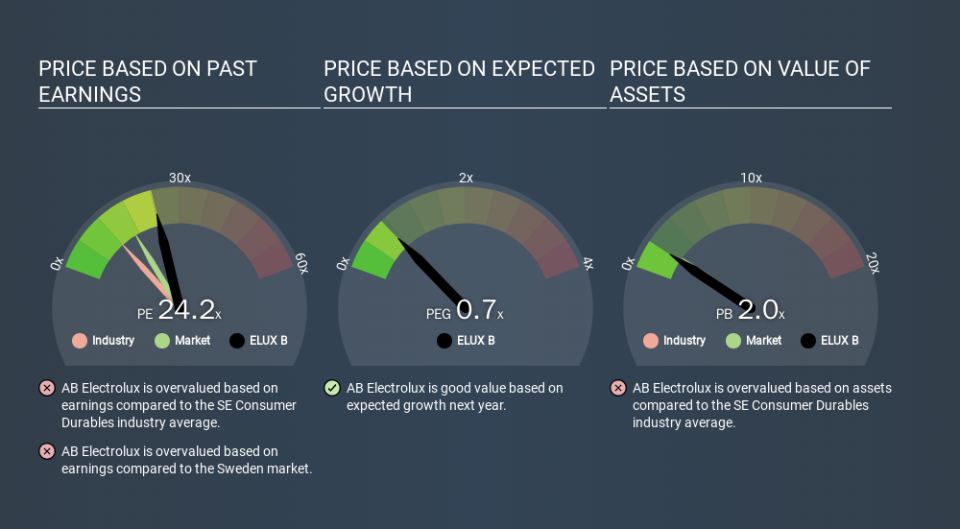
We can tell from its P/E ratio of 24.20 that there is some investor optimism about AB Electrolux. The image below shows that AB Electrolux has a higher P/E than the average (10.7) P/E for companies in the consumer durables industry.
Its relatively high P/E ratio indicates that AB Electrolux shareholders think it will perform better than other companies in its industry classification. Shareholders are clearly optimistic, but the future is always uncertain. So further research is always essential. I often monitor director buying and selling.
How Growth Rates Impact P/E Ratios
Companies that shrink earnings per share quickly will rapidly decrease the 'E' in the equation. That means unless the share price falls, the P/E will increase in a few years. A higher P/E should indicate the stock is expensive relative to others -- and that may encourage shareholders to sell.
AB Electrolux's earnings per share fell by 36% in the last twelve months. And it has shrunk its earnings per share by 4.1% per year over the last five years. This growth rate might warrant a below average P/E ratio.
Don't Forget: The P/E Does Not Account For Debt or Bank Deposits
The 'Price' in P/E reflects the market capitalization of the company. So it won't reflect the advantage of cash, or disadvantage of debt. In theory, a company can lower its future P/E ratio by using cash or debt to invest in growth.
While growth expenditure doesn't always pay off, the point is that it is a good option to have; but one that the P/E ratio ignores.
Is Debt Impacting AB Electrolux's P/E?
AB Electrolux's net debt is 1.6% of its market cap. The market might award it a higher P/E ratio if it had net cash, but its unlikely this low level of net borrowing is having a big impact on the P/E multiple.
The Verdict On AB Electrolux's P/E Ratio
AB Electrolux trades on a P/E ratio of 24.2, which is above its market average of 14.5. With modest debt but no EPS growth in the last year, it's fair to say the P/E implies some optimism about future earnings, from the market. What can be absolutely certain is that the market has become significantly less optimistic about AB Electrolux over the last month, with the P/E ratio falling from 35.6 back then to 24.2 today. For those who prefer to invest with the flow of momentum, that might be a bad sign, but for a contrarian, it may signal opportunity.
When the market is wrong about a stock, it gives savvy investors an opportunity. People often underestimate remarkable growth -- so investors can make money when fast growth is not fully appreciated. So this free visualization of the analyst consensus on future earnings could help you make the right decision about whether to buy, sell, or hold.
Of course you might be able to find a better stock than AB Electrolux. So you may wish to see this free collection of other companies that have grown earnings strongly.
If you spot an error that warrants correction, please contact the editor at editorial-team@simplywallst.com. This article by Simply Wall St is general in nature. It does not constitute a recommendation to buy or sell any stock, and does not take account of your objectives, or your financial situation. Simply Wall St has no position in the stocks mentioned.
We aim to bring you long-term focused research analysis driven by fundamental data. Note that our analysis may not factor in the latest price-sensitive company announcements or qualitative material. Thank you for reading.
