What Does Action Construction Equipment Limited's (NSE:ACE) P/E Ratio Tell You?

This article is for investors who would like to improve their understanding of price to earnings ratios (P/E ratios). We'll apply a basic P/E ratio analysis to Action Construction Equipment Limited's (NSE:ACE), to help you decide if the stock is worth further research. Action Construction Equipment has a price to earnings ratio of 13.67, based on the last twelve months. That is equivalent to an earnings yield of about 7.3%.
See our latest analysis for Action Construction Equipment
How Do You Calculate A P/E Ratio?
The formula for price to earnings is:
Price to Earnings Ratio = Share Price ÷ Earnings per Share (EPS)
Or for Action Construction Equipment:
P/E of 13.67 = ₹65.3 ÷ ₹4.78 (Based on the year to March 2019.)
Is A High P/E Ratio Good?
The higher the P/E ratio, the higher the price tag of a business, relative to its trailing earnings. That is not a good or a bad thing per se, but a high P/E does imply buyers are optimistic about the future.
Does Action Construction Equipment Have A Relatively High Or Low P/E For Its Industry?
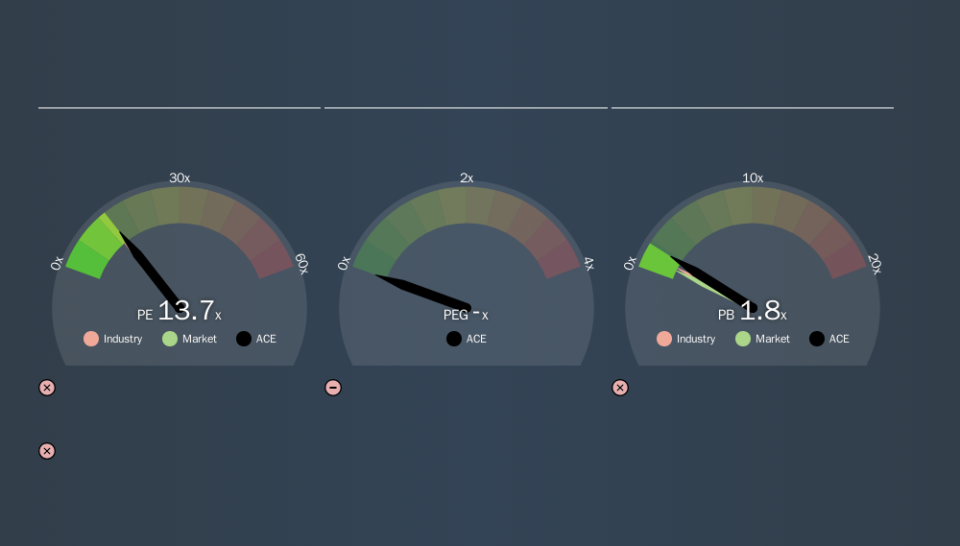
The P/E ratio indicates whether the market has higher or lower expectations of a company. The image below shows that Action Construction Equipment has a P/E ratio that is roughly in line with the machinery industry average (12.8).
Its P/E ratio suggests that Action Construction Equipment shareholders think that in the future it will perform about the same as other companies in its industry classification. So if Action Construction Equipment actually outperforms its peers going forward, that should be a positive for the share price. Checking factors such as director buying and selling. could help you form your own view on if that will happen.
How Growth Rates Impact P/E Ratios
Probably the most important factor in determining what P/E a company trades on is the earnings growth. Earnings growth means that in the future the 'E' will be higher. And in that case, the P/E ratio itself will drop rather quickly. Then, a lower P/E should attract more buyers, pushing the share price up.
Action Construction Equipment's earnings per share grew by -7.6% in the last twelve months. And it has bolstered its earnings per share by 59% per year over the last five years.
Don't Forget: The P/E Does Not Account For Debt or Bank Deposits
The 'Price' in P/E reflects the market capitalization of the company. Thus, the metric does not reflect cash or debt held by the company. Theoretically, a business can improve its earnings (and produce a lower P/E in the future) by investing in growth. That means taking on debt (or spending its cash).
Spending on growth might be good or bad a few years later, but the point is that the P/E ratio does not account for the option (or lack thereof).
How Does Action Construction Equipment's Debt Impact Its P/E Ratio?
Action Construction Equipment has net debt worth just 2.0% of its market capitalization. So it doesn't have as many options as it would with net cash, but its debt would not have much of an impact on its P/E ratio.
The Bottom Line On Action Construction Equipment's P/E Ratio
Action Construction Equipment has a P/E of 13.7. That's around the same as the average in the IN market, which is 13.3. Given it has some debt, and grew earnings a bit last year, the P/E indicates the market is expecting steady ongoing progress.
Investors should be looking to buy stocks that the market is wrong about. If the reality for a company is better than it expects, you can make money by buying and holding for the long term. So this free report on the analyst consensus forecasts could help you make a master move on this stock.
Of course, you might find a fantastic investment by looking at a few good candidates. So take a peek at this free list of companies with modest (or no) debt, trading on a P/E below 20.
We aim to bring you long-term focused research analysis driven by fundamental data. Note that our analysis may not factor in the latest price-sensitive company announcements or qualitative material.
If you spot an error that warrants correction, please contact the editor at editorial-team@simplywallst.com. This article by Simply Wall St is general in nature. It does not constitute a recommendation to buy or sell any stock, and does not take account of your objectives, or your financial situation. Simply Wall St has no position in the stocks mentioned. Thank you for reading.
