Does Ailleron SA’s (WSE:ALL) Past Performance Indicate A Stronger Future?

After looking at Ailleron SA’s (WSE:ALL) latest earnings announcement (31 March 2018), I found it useful to revisit the company’s performance in the past couple of years and assess this against the most recent figures. As a long term investor, I pay close attention to earnings trend, rather than the figures published at one point in time. I also compare against an industry benchmark to check whether Ailleron’s performance has been impacted by industry movements. In this article I briefly touch on my key findings. Check out our latest analysis for Ailleron
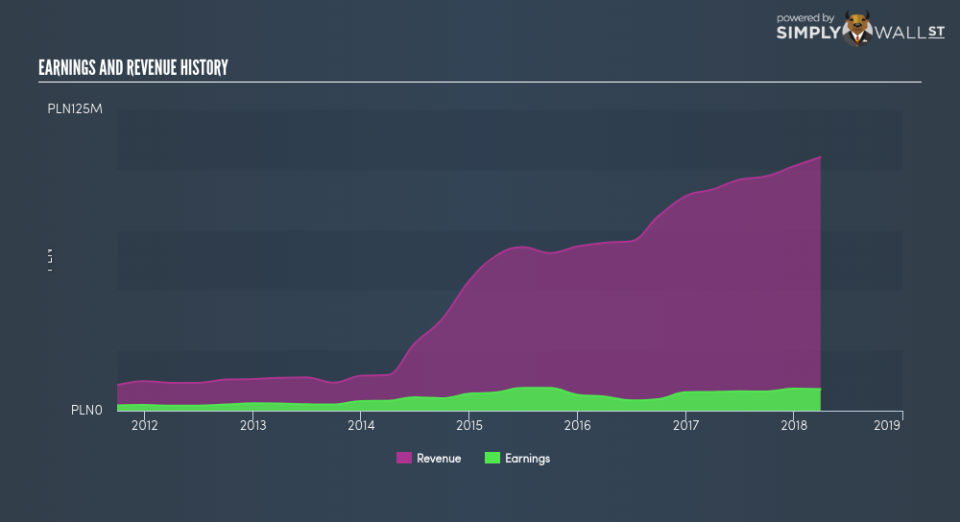
Commentary On ALL’s Past Performance
ALL’s trailing twelve-month earnings (from 31 March 2018) of zł8.92m has jumped 14.73% compared to the previous year. However, this one-year growth rate has been lower than its average earnings growth rate over the past 5 years of 20.42%, indicating the rate at which ALL is growing has slowed down. To understand what’s happening, let’s examine what’s transpiring with margins and whether the entire industry is experiencing the hit as well.
Revenue growth in the last few years, has been positive, however, earnings growth has been lagging behind meaning Ailleron has been growing its expenses by a lot more. This hurts margins and earnings, and is not a sustainable practice. Eyeballing growth from a sector-level, the PL software industry has been growing its average earnings by double-digit 12.85% in the past twelve months, and 20.42% over the previous five years. This suggests that any tailwind the industry is deriving benefit from, Ailleron is capable of leveraging this to its advantage.
In terms of returns from investment, Ailleron has not invested its equity funds well, leading to a 10.90% return on equity (ROE), below the sensible minimum of 20%. Furthermore, its return on assets (ROA) of 7.49% is below the PL Software industry of 11.50%, indicating Ailleron’s are utilized less efficiently. And finally, its return on capital (ROC), which also accounts for Ailleron’s debt level, has declined over the past 3 years from 12.58% to 9.00%. This correlates with an increase in debt holding, with debt-to-equity ratio rising from 0.75% to 14.75% over the past 5 years.
What does this mean?
Though Ailleron’s past data is helpful, it is only one aspect of my investment thesis. Positive growth and profitability are what investors like to see in a company’s track record, but how do we properly assess sustainability? You should continue to research Ailleron to get a better picture of the stock by looking at:
Future Outlook: What are well-informed industry analysts predicting for ALL’s future growth? Take a look at our free research report of analyst consensus for ALL’s outlook.
Financial Health: Is ALL’s operations financially sustainable? Balance sheets can be hard to analyze, which is why we’ve done it for you. Check out our financial health checks here.
Other High-Performing Stocks: Are there other stocks that provide better prospects with proven track records? Explore our free list of these great stocks here.
NB: Figures in this article are calculated using data from the trailing twelve months from 31 March 2018. This may not be consistent with full year annual report figures.
To help readers see pass the short term volatility of the financial market, we aim to bring you a long-term focused research analysis purely driven by fundamental data. Note that our analysis does not factor in the latest price sensitive company announcements.
The author is an independent contributor and at the time of publication had no position in the stocks mentioned.
