Does AMCON Distributing Company (NYSEMKT:DIT) Have A Good P/E Ratio?

AMCON Distributing (NYSEMKT:DIT) shares have retraced a considerable in the last month. Even longer term holders have taken a real hit with the stock declining 9.8% in the last year. But shareholders who bought at the right time will be smiling, given that the stock is up 9.6% over the last quarter.
All else being equal, a sharp share price increase should make a stock less attractive to potential investors. In the long term, share prices tend to follow earnings per share, but in the short term prices bounce around in response to short term factors (which are not always obvious). So some would prefer to hold off buying when there is a lot of optimism towards a stock. Perhaps the simplest way to get a read on investors' expectations of a business is to look at its Price to Earnings Ratio (PE Ratio). Investors have optimistic expectations of companies with higher P/E ratios, compared to companies with lower P/E ratios.
View our latest analysis for AMCON Distributing
Does AMCON Distributing Have A Relatively High Or Low P/E For Its Industry?
AMCON Distributing's P/E is 19.39. You can see in the image below that the average P/E (18.9) for companies in the retail distributors industry is roughly the same as AMCON Distributing's P/E.
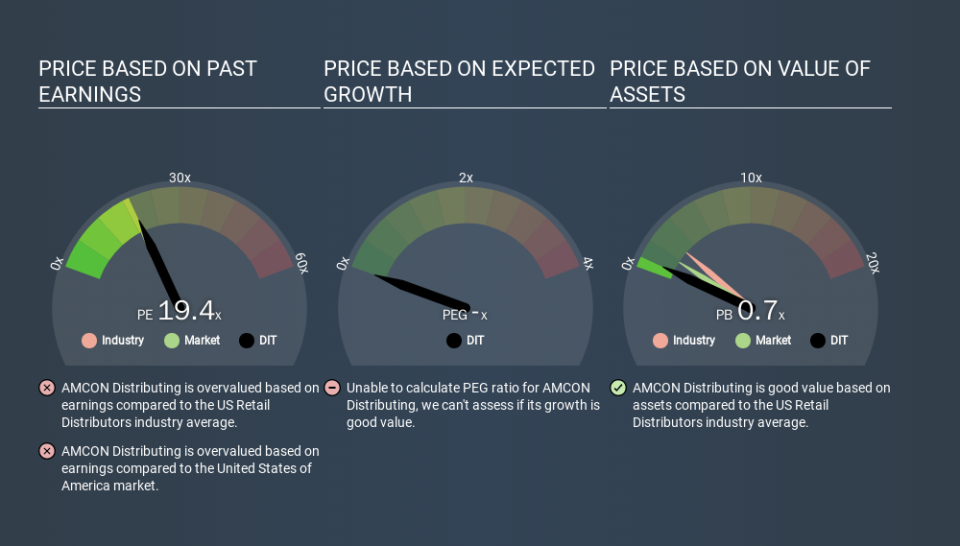
Its P/E ratio suggests that AMCON Distributing shareholders think that in the future it will perform about the same as other companies in its industry classification. So if AMCON Distributing actually outperforms its peers going forward, that should be a positive for the share price. Further research into factors such as insider buying and selling, could help you form your own view on whether that is likely.
How Growth Rates Impact P/E Ratios
Companies that shrink earnings per share quickly will rapidly decrease the 'E' in the equation. That means even if the current P/E is low, it will increase over time if the share price stays flat. So while a stock may look cheap based on past earnings, it could be expensive based on future earnings.
AMCON Distributing saw earnings per share decrease by 21% last year. And EPS is down 13% a year, over the last 5 years. This growth rate might warrant a below average P/E ratio.
Don't Forget: The P/E Does Not Account For Debt or Bank Deposits
It's important to note that the P/E ratio considers the market capitalization, not the enterprise value. Thus, the metric does not reflect cash or debt held by the company. Theoretically, a business can improve its earnings (and produce a lower P/E in the future) by investing in growth. That means taking on debt (or spending its cash).
Spending on growth might be good or bad a few years later, but the point is that the P/E ratio does not account for the option (or lack thereof).
So What Does AMCON Distributing's Balance Sheet Tell Us?
AMCON Distributing has net debt worth 81% of its market capitalization. This is enough debt that you'd have to make some adjustments before using the P/E ratio to compare it to a company with net cash.
The Verdict On AMCON Distributing's P/E Ratio
AMCON Distributing trades on a P/E ratio of 19.4, which is fairly close to the US market average of 18.5. With relatively high debt, and no earnings per share growth over twelve months, the P/E suggests that many have an expectation that company will find some growth. Given AMCON Distributing's P/E ratio has declined from 19.4 to 19.4 in the last month, we know for sure that the market is less confident about the business today, than it was back then. For those who prefer to invest with the flow of momentum, that might be a bad sign, but for a contrarian, it may signal opportunity.
Investors should be looking to buy stocks that the market is wrong about. As value investor Benjamin Graham famously said, 'In the short run, the market is a voting machine but in the long run, it is a weighing machine. Although we don't have analyst forecasts you could get a better understanding of its growth by checking out this more detailed historical graph of earnings, revenue and cash flow.
You might be able to find a better buy than AMCON Distributing. If you want a selection of possible winners, check out this free list of interesting companies that trade on a P/E below 20 (but have proven they can grow earnings).
If you spot an error that warrants correction, please contact the editor at editorial-team@simplywallst.com. This article by Simply Wall St is general in nature. It does not constitute a recommendation to buy or sell any stock, and does not take account of your objectives, or your financial situation. Simply Wall St has no position in the stocks mentioned.
We aim to bring you long-term focused research analysis driven by fundamental data. Note that our analysis may not factor in the latest price-sensitive company announcements or qualitative material. Thank you for reading.
