Does Amerisafe, Inc.'s (NASDAQ:AMSF) P/E Ratio Signal A Buying Opportunity?

This article is for investors who would like to improve their understanding of price to earnings ratios (P/E ratios). We'll apply a basic P/E ratio analysis to Amerisafe, Inc.'s (NASDAQ:AMSF), to help you decide if the stock is worth further research. Based on the last twelve months, Amerisafe's P/E ratio is 16.17. That is equivalent to an earnings yield of about 6.2%.
View our latest analysis for Amerisafe
How Do You Calculate A P/E Ratio?
The formula for price to earnings is:
Price to Earnings Ratio = Price per Share ÷ Earnings per Share (EPS)
Or for Amerisafe:
P/E of 16.17 = USD65.12 ÷ USD4.03 (Based on the year to September 2019.)
Is A High Price-to-Earnings Ratio Good?
A higher P/E ratio implies that investors pay a higher price for the earning power of the business. That is not a good or a bad thing per se, but a high P/E does imply buyers are optimistic about the future.
Does Amerisafe Have A Relatively High Or Low P/E For Its Industry?
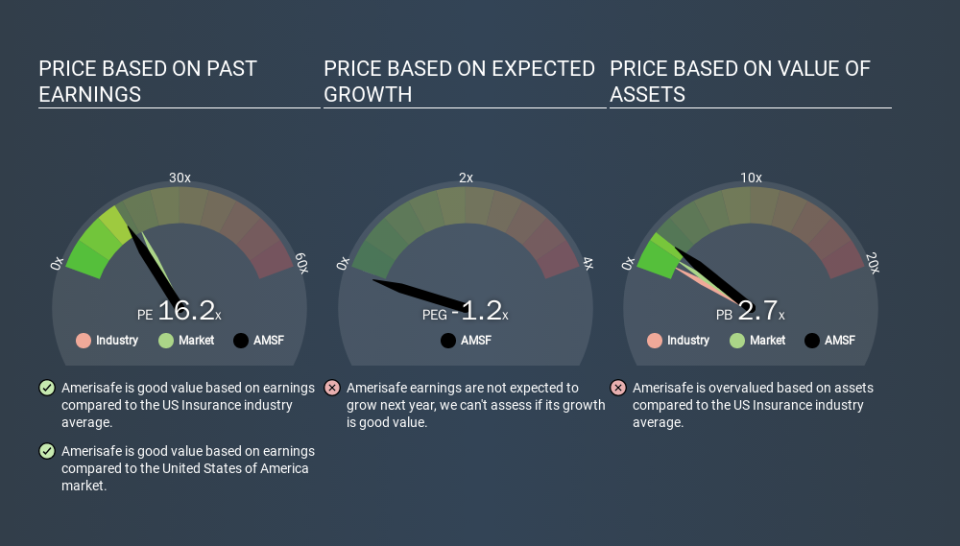
One good way to get a quick read on what market participants expect of a company is to look at its P/E ratio. You can see in the image below that the average P/E (16.4) for companies in the insurance industry is roughly the same as Amerisafe's P/E.
Its P/E ratio suggests that Amerisafe shareholders think that in the future it will perform about the same as other companies in its industry classification. So if Amerisafe actually outperforms its peers going forward, that should be a positive for the share price. I would further inform my view by checking insider buying and selling., among other things.
How Growth Rates Impact P/E Ratios
If earnings fall then in the future the 'E' will be lower. That means unless the share price falls, the P/E will increase in a few years. Then, a higher P/E might scare off shareholders, pushing the share price down.
Notably, Amerisafe grew EPS by a whopping 45% in the last year. And earnings per share have improved by 6.7% annually, over the last five years. I'd therefore be a little surprised if its P/E ratio was not relatively high. Unfortunately, earnings per share are down 2.1% a year, over 3 years.
Don't Forget: The P/E Does Not Account For Debt or Bank Deposits
It's important to note that the P/E ratio considers the market capitalization, not the enterprise value. In other words, it does not consider any debt or cash that the company may have on the balance sheet. Hypothetically, a company could reduce its future P/E ratio by spending its cash (or taking on debt) to achieve higher earnings.
While growth expenditure doesn't always pay off, the point is that it is a good option to have; but one that the P/E ratio ignores.
How Does Amerisafe's Debt Impact Its P/E Ratio?
With net cash of US$147m, Amerisafe has a very strong balance sheet, which may be important for its business. Having said that, at 12% of its market capitalization the cash hoard would contribute towards a higher P/E ratio.
The Bottom Line On Amerisafe's P/E Ratio
Amerisafe has a P/E of 16.2. That's below the average in the US market, which is 18.9. Not only should the net cash position reduce risk, but the recent growth has been impressive. The below average P/E ratio suggests that market participants don't believe the strong growth will continue.
Investors have an opportunity when market expectations about a stock are wrong. If it is underestimating a company, investors can make money by buying and holding the shares until the market corrects itself. So this free visual report on analyst forecasts could hold the key to an excellent investment decision.
Of course, you might find a fantastic investment by looking at a few good candidates. So take a peek at this free list of companies with modest (or no) debt, trading on a P/E below 20.
If you spot an error that warrants correction, please contact the editor at editorial-team@simplywallst.com. This article by Simply Wall St is general in nature. It does not constitute a recommendation to buy or sell any stock, and does not take account of your objectives, or your financial situation. Simply Wall St has no position in the stocks mentioned.
We aim to bring you long-term focused research analysis driven by fundamental data. Note that our analysis may not factor in the latest price-sensitive company announcements or qualitative material. Thank you for reading.
