How Does Arkema's (EPA:AKE) P/E Compare To Its Industry, After Its Big Share Price Gain?

Those holding Arkema (EPA:AKE) shares must be pleased that the share price has rebounded 36% in the last thirty days. But unfortunately, the stock is still down by 16% over a quarter. But shareholders may not all be feeling jubilant, since the share price is still down 22% in the last year.
All else being equal, a sharp share price increase should make a stock less attractive to potential investors. In the long term, share prices tend to follow earnings per share, but in the short term prices bounce around in response to short term factors (which are not always obvious). The implication here is that deep value investors might steer clear when expectations of a company are too high. Perhaps the simplest way to get a read on investors' expectations of a business is to look at its Price to Earnings Ratio (PE Ratio). A high P/E ratio means that investors have a high expectation about future growth, while a low P/E ratio means they have low expectations about future growth.
See our latest analysis for Arkema
How Does Arkema's P/E Ratio Compare To Its Peers?
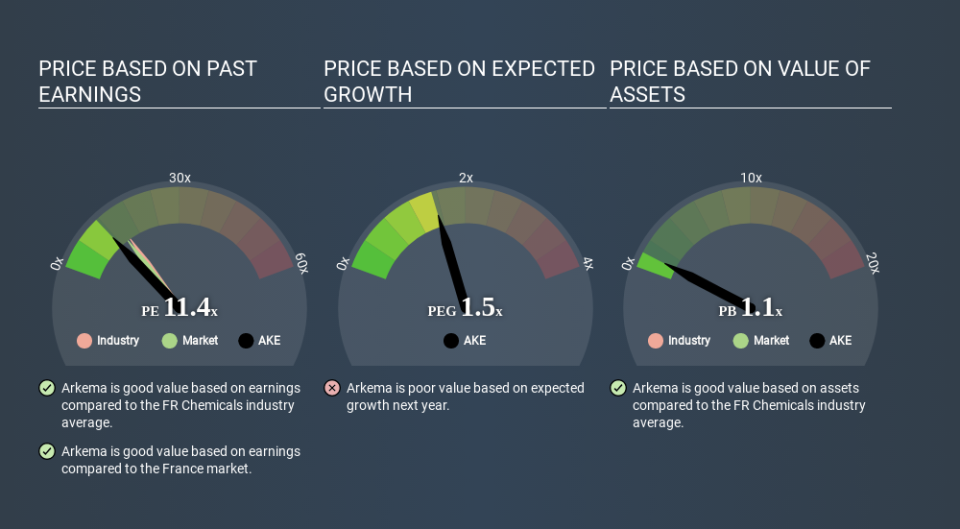
Arkema's P/E of 11.44 indicates relatively low sentiment towards the stock. If you look at the image below, you can see Arkema has a lower P/E than the average (14.8) in the chemicals industry classification.
This suggests that market participants think Arkema will underperform other companies in its industry. While current expectations are low, the stock could be undervalued if the situation is better than the market assumes. It is arguably worth checking if insiders are buying shares, because that might imply they believe the stock is undervalued.
How Growth Rates Impact P/E Ratios
Earnings growth rates have a big influence on P/E ratios. That's because companies that grow earnings per share quickly will rapidly increase the 'E' in the equation. That means even if the current P/E is high, it will reduce over time if the share price stays flat. And as that P/E ratio drops, the company will look cheap, unless its share price increases.
Arkema shrunk earnings per share by 27% over the last year. But over the longer term (5 years) earnings per share have increased by 21%.
Remember: P/E Ratios Don't Consider The Balance Sheet
Don't forget that the P/E ratio considers market capitalization. So it won't reflect the advantage of cash, or disadvantage of debt. Theoretically, a business can improve its earnings (and produce a lower P/E in the future) by investing in growth. That means taking on debt (or spending its cash).
Spending on growth might be good or bad a few years later, but the point is that the P/E ratio does not account for the option (or lack thereof).
So What Does Arkema's Balance Sheet Tell Us?
Arkema's net debt equates to 26% of its market capitalization. While that's enough to warrant consideration, it doesn't really concern us.
The Bottom Line On Arkema's P/E Ratio
Arkema has a P/E of 11.4. That's below the average in the FR market, which is 14.0. Since it only carries a modest debt load, it's likely the low expectations implied by the P/E ratio arise from the lack of recent earnings growth. What is very clear is that the market has become more optimistic about Arkema over the last month, with the P/E ratio rising from 8.4 back then to 11.4 today. If you like to buy stocks that have recently impressed the market, then this one might be a candidate; but if you prefer to invest when there is 'blood in the streets', then you may feel the opportunity has passed.
Investors should be looking to buy stocks that the market is wrong about. If it is underestimating a company, investors can make money by buying and holding the shares until the market corrects itself. So this free visualization of the analyst consensus on future earnings could help you make the right decision about whether to buy, sell, or hold.
But note: Arkema may not be the best stock to buy. So take a peek at this free list of interesting companies with strong recent earnings growth (and a P/E ratio below 20).
If you spot an error that warrants correction, please contact the editor at editorial-team@simplywallst.com. This article by Simply Wall St is general in nature. It does not constitute a recommendation to buy or sell any stock, and does not take account of your objectives, or your financial situation. Simply Wall St has no position in the stocks mentioned.
We aim to bring you long-term focused research analysis driven by fundamental data. Note that our analysis may not factor in the latest price-sensitive company announcements or qualitative material. Thank you for reading.
