How Does ASGN's (NYSE:ASGN) P/E Compare To Its Industry, After The Share Price Drop?

Unfortunately for some shareholders, the ASGN (NYSE:ASGN) share price has dived 45% in the last thirty days. Indeed the recent decline has arguably caused some bitterness for shareholders who have held through the 45% drop over twelve months.
Assuming nothing else has changed, a lower share price makes a stock more attractive to potential buyers. While the market sentiment towards a stock is very changeable, in the long run, the share price will tend to move in the same direction as earnings per share. The implication here is that long term investors have an opportunity when expectations of a company are too low. Perhaps the simplest way to get a read on investors' expectations of a business is to look at its Price to Earnings Ratio (PE Ratio). A high P/E implies that investors have high expectations of what a company can achieve compared to a company with a low P/E ratio.
Check out our latest analysis for ASGN
Does ASGN Have A Relatively High Or Low P/E For Its Industry?
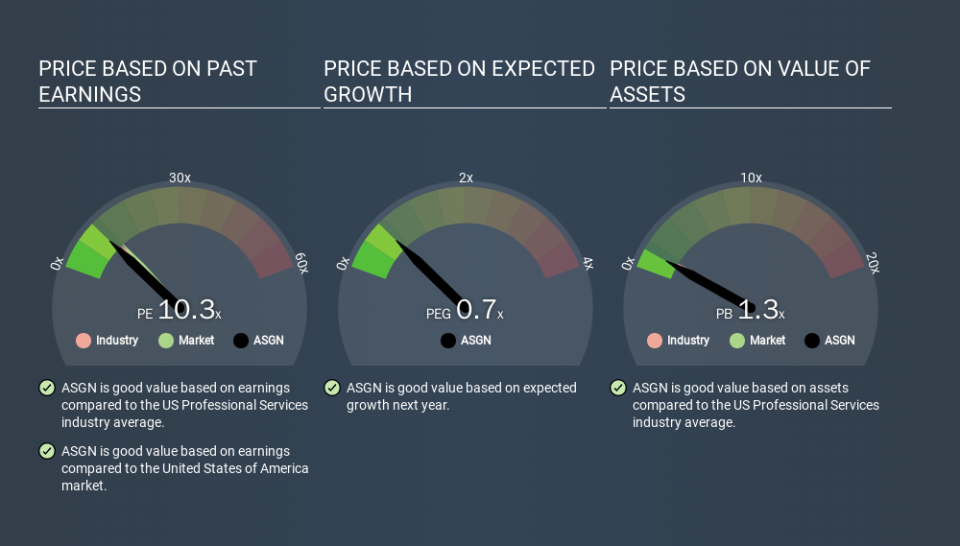
ASGN's P/E of 10.26 indicates relatively low sentiment towards the stock. If you look at the image below, you can see ASGN has a lower P/E than the average (11.9) in the professional services industry classification.
Its relatively low P/E ratio indicates that ASGN shareholders think it will struggle to do as well as other companies in its industry classification. Many investors like to buy stocks when the market is pessimistic about their prospects. It is arguably worth checking if insiders are buying shares, because that might imply they believe the stock is undervalued.
How Growth Rates Impact P/E Ratios
Earnings growth rates have a big influence on P/E ratios. Earnings growth means that in the future the 'E' will be higher. That means even if the current P/E is high, it will reduce over time if the share price stays flat. Then, a lower P/E should attract more buyers, pushing the share price up.
ASGN saw earnings per share improve by 9.6% last year. And its annual EPS growth rate over 5 years is 19%.
Don't Forget: The P/E Does Not Account For Debt or Bank Deposits
The 'Price' in P/E reflects the market capitalization of the company. In other words, it does not consider any debt or cash that the company may have on the balance sheet. Theoretically, a business can improve its earnings (and produce a lower P/E in the future) by investing in growth. That means taking on debt (or spending its cash).
Such expenditure might be good or bad, in the long term, but the point here is that the balance sheet is not reflected by this ratio.
Is Debt Impacting ASGN's P/E?
ASGN has net debt worth 52% of its market capitalization. This is a reasonably significant level of debt -- all else being equal you'd expect a much lower P/E than if it had net cash.
The Bottom Line On ASGN's P/E Ratio
ASGN has a P/E of 10.3. That's below the average in the US market, which is 11.8. The meaningful debt load is probably contributing to low expectations, even though it has improved earnings recently. What can be absolutely certain is that the market has become significantly less optimistic about ASGN over the last month, with the P/E ratio falling from 18.5 back then to 10.3 today. For those who don't like to trade against momentum, that could be a warning sign, but a contrarian investor might want to take a closer look.
Investors should be looking to buy stocks that the market is wrong about. As value investor Benjamin Graham famously said, 'In the short run, the market is a voting machine but in the long run, it is a weighing machine. So this free visualization of the analyst consensus on future earnings could help you make the right decision about whether to buy, sell, or hold.
Of course, you might find a fantastic investment by looking at a few good candidates. So take a peek at this free list of companies with modest (or no) debt, trading on a P/E below 20.
If you spot an error that warrants correction, please contact the editor at editorial-team@simplywallst.com. This article by Simply Wall St is general in nature. It does not constitute a recommendation to buy or sell any stock, and does not take account of your objectives, or your financial situation. Simply Wall St has no position in the stocks mentioned.
We aim to bring you long-term focused research analysis driven by fundamental data. Note that our analysis may not factor in the latest price-sensitive company announcements or qualitative material. Thank you for reading.
