How Does Benchmark Electronics's (NYSE:BHE) P/E Compare To Its Industry, After The Share Price Drop?

Unfortunately for some shareholders, the Benchmark Electronics (NYSE:BHE) share price has dived 32% in the last thirty days. Indeed the recent decline has arguably caused some bitterness for shareholders who have held through the 33% drop over twelve months.
Assuming nothing else has changed, a lower share price makes a stock more attractive to potential buyers. While the market sentiment towards a stock is very changeable, in the long run, the share price will tend to move in the same direction as earnings per share. So, on certain occasions, long term focussed investors try to take advantage of pessimistic expectations to buy shares at a better price. One way to gauge market expectations of a stock is to look at its Price to Earnings Ratio (PE Ratio). A high P/E implies that investors have high expectations of what a company can achieve compared to a company with a low P/E ratio.
View our latest analysis for Benchmark Electronics
How Does Benchmark Electronics's P/E Ratio Compare To Its Peers?
We can tell from its P/E ratio of 30.92 that there is some investor optimism about Benchmark Electronics. The image below shows that Benchmark Electronics has a higher P/E than the average (14.4) P/E for companies in the electronic industry.
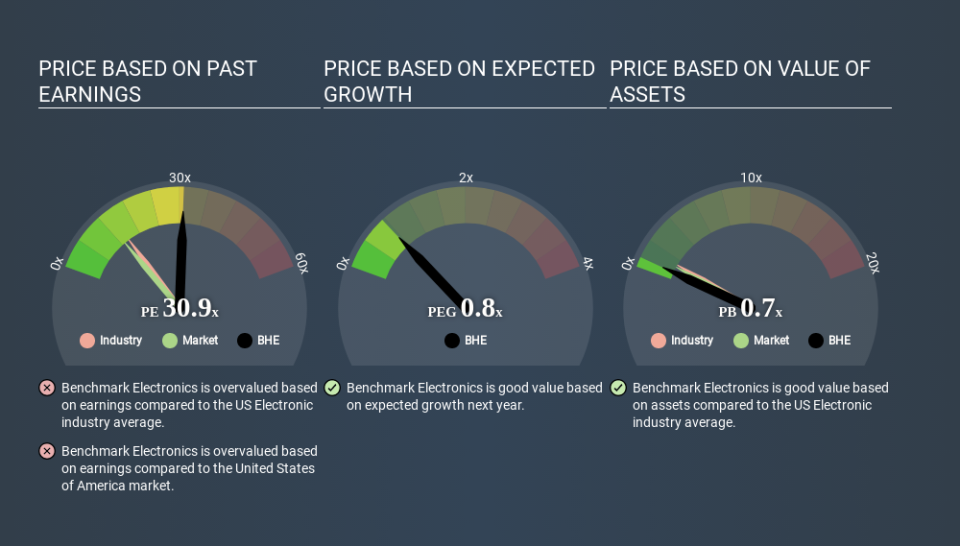
That means that the market expects Benchmark Electronics will outperform other companies in its industry. The market is optimistic about the future, but that doesn't guarantee future growth. So investors should delve deeper. I like to check if company insiders have been buying or selling.
How Growth Rates Impact P/E Ratios
When earnings fall, the 'E' decreases, over time. That means unless the share price falls, the P/E will increase in a few years. Then, a higher P/E might scare off shareholders, pushing the share price down.
Most would be impressed by Benchmark Electronics earnings growth of 24% in the last year. In contrast, EPS has decreased by 17%, annually, over 5 years.
A Limitation: P/E Ratios Ignore Debt and Cash In The Bank
One drawback of using a P/E ratio is that it considers market capitalization, but not the balance sheet. Thus, the metric does not reflect cash or debt held by the company. Hypothetically, a company could reduce its future P/E ratio by spending its cash (or taking on debt) to achieve higher earnings.
Spending on growth might be good or bad a few years later, but the point is that the P/E ratio does not account for the option (or lack thereof).
Is Debt Impacting Benchmark Electronics's P/E?
With net cash of US$205m, Benchmark Electronics has a very strong balance sheet, which may be important for its business. Having said that, at 30% of its market capitalization the cash hoard would contribute towards a higher P/E ratio.
The Bottom Line On Benchmark Electronics's P/E Ratio
Benchmark Electronics has a P/E of 30.9. That's higher than the average in its market, which is 12.5. Its net cash position supports a higher P/E ratio, as does its solid recent earnings growth. So it is not surprising the market is probably extrapolating recent growth well into the future, reflected in the relatively high P/E ratio. What can be absolutely certain is that the market has become significantly less optimistic about Benchmark Electronics over the last month, with the P/E ratio falling from 45.7 back then to 30.9 today. For those who don't like to trade against momentum, that could be a warning sign, but a contrarian investor might want to take a closer look.
Investors should be looking to buy stocks that the market is wrong about. People often underestimate remarkable growth -- so investors can make money when fast growth is not fully appreciated. So this free visualization of the analyst consensus on future earnings could help you make the right decision about whether to buy, sell, or hold.
But note: Benchmark Electronics may not be the best stock to buy. So take a peek at this free list of interesting companies with strong recent earnings growth (and a P/E ratio below 20).
If you spot an error that warrants correction, please contact the editor at editorial-team@simplywallst.com. This article by Simply Wall St is general in nature. It does not constitute a recommendation to buy or sell any stock, and does not take account of your objectives, or your financial situation. Simply Wall St has no position in the stocks mentioned.
We aim to bring you long-term focused research analysis driven by fundamental data. Note that our analysis may not factor in the latest price-sensitive company announcements or qualitative material. Thank you for reading.
