Does BGMC International Limited (HKG:1693) Have A Good P/E Ratio?

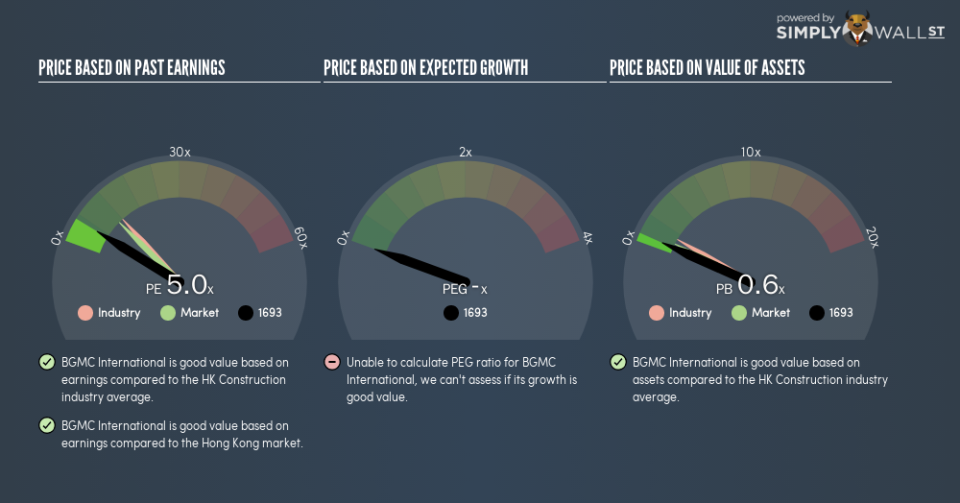
This article is written for those who want to get better at using price to earnings ratios (P/E ratios). We’ll show how you can use BGMC International Limited’s (HKG:1693) P/E ratio to inform your assessment of the investment opportunity. BGMC International has a price to earnings ratio of 5.01, based on the last twelve months. That is equivalent to an earnings yield of about 20%.
Check out our latest analysis for BGMC International
How Do You Calculate A P/E Ratio?
The formula for P/E is:
Price to Earnings Ratio = Price per Share (in the reporting currency) ÷ Earnings per Share (EPS)
Or for BGMC International:
P/E of 5.01 = MYR0.11 (Note: this is the share price in the reporting currency, namely, MYR ) ÷ MYR0.022 (Based on the year to March 2018.)
Is A High P/E Ratio Good?
A higher P/E ratio implies that investors pay a higher price for the earning power of the business. That isn’t a good or a bad thing on its own, but a high P/E means that buyers have a higher opinion of the business’s prospects, relative to stocks with a lower P/E.
How Growth Rates Impact P/E Ratios
Probably the most important factor in determining what P/E a company trades on is the earnings growth. Earnings growth means that in the future the ‘E’ will be higher. That means even if the current P/E is high, it will reduce over time if the share price stays flat. So while a stock may look expensive based on past earnings, it could be cheap based on future earnings.
BGMC International’s earnings per share fell by 58% in the last twelve months.
How Does BGMC International’s P/E Ratio Compare To Its Peers?
We can get an indication of market expectations by looking at the P/E ratio. The image below shows that BGMC International has a lower P/E than the average (12) P/E for companies in the construction industry.
This suggests that market participants think BGMC International will underperform other companies in its industry. Since the market seems unimpressed with BGMC International, it’s quite possible it could surprise on the upside. It is arguably worth checking if insiders are buying shares, because that might imply they believe the stock is undervalued.
Don’t Forget: The P/E Does Not Account For Debt or Bank Deposits
It’s important to note that the P/E ratio considers the market capitalization, not the enterprise value. Thus, the metric does not reflect cash or debt held by the company. Theoretically, a business can improve its earnings (and produce a lower P/E in the future), by taking on debt (or spending its remaining cash).
Such spending might be good or bad, overall, but the key point here is that you need to look at debt to understand the P/E ratio in context.
How Does BGMC International’s Debt Impact Its P/E Ratio?
BGMC International has net debt worth 73% of its market capitalization. If you want to compare its P/E ratio to other companies, you should absolutely keep in mind it has significant borrowings.
The Verdict On BGMC International’s P/E Ratio
BGMC International trades on a P/E ratio of 5, which is below the HK market average of 10.7. Given meaningful debt, and a lack of recent growth, the market looks to be extrapolating this recent performance; reflecting low expectations for the future.
Investors have an opportunity when market expectations about a stock are wrong. If the reality for a company is not as bad as the P/E ratio indicates, then the share price should increase as the market realizes this. Although we don’t have analyst forecasts, you could get a better understanding of its growth by checking out this more detailed historical graph of earnings, revenue and cash flow.
You might be able to find a better buy than BGMC International. If you want a selection of possible winners, check out this free list of interesting companies that trade on a P/E below 20 (but have proven they can grow earnings).
To help readers see past the short term volatility of the financial market, we aim to bring you a long-term focused research analysis purely driven by fundamental data. Note that our analysis does not factor in the latest price-sensitive company announcements.
The author is an independent contributor and at the time of publication had no position in the stocks mentioned. For errors that warrant correction please contact the editor at editorial-team@simplywallst.com.
