Does Bloomin' Brands, Inc.'s (NASDAQ:BLMN) P/E Ratio Signal A Buying Opportunity?

This article is written for those who want to get better at using price to earnings ratios (P/E ratios). We'll apply a basic P/E ratio analysis to Bloomin' Brands, Inc.'s (NASDAQ:BLMN), to help you decide if the stock is worth further research. Bloomin' Brands has a price to earnings ratio of 17.45, based on the last twelve months. That corresponds to an earnings yield of approximately 5.7%.
View our latest analysis for Bloomin' Brands
How Do You Calculate A P/E Ratio?
The formula for P/E is:
Price to Earnings Ratio = Share Price ÷ Earnings per Share (EPS)
Or for Bloomin' Brands:
P/E of 17.45 = $22.00 ÷ $1.26 (Based on the trailing twelve months to September 2019.)
Is A High Price-to-Earnings Ratio Good?
A higher P/E ratio means that investors are paying a higher price for each $1 of company earnings. That isn't necessarily good or bad, but a high P/E implies relatively high expectations of what a company can achieve in the future.
How Does Bloomin' Brands's P/E Ratio Compare To Its Peers?
The P/E ratio indicates whether the market has higher or lower expectations of a company. If you look at the image below, you can see Bloomin' Brands has a lower P/E than the average (24.3) in the hospitality industry classification.
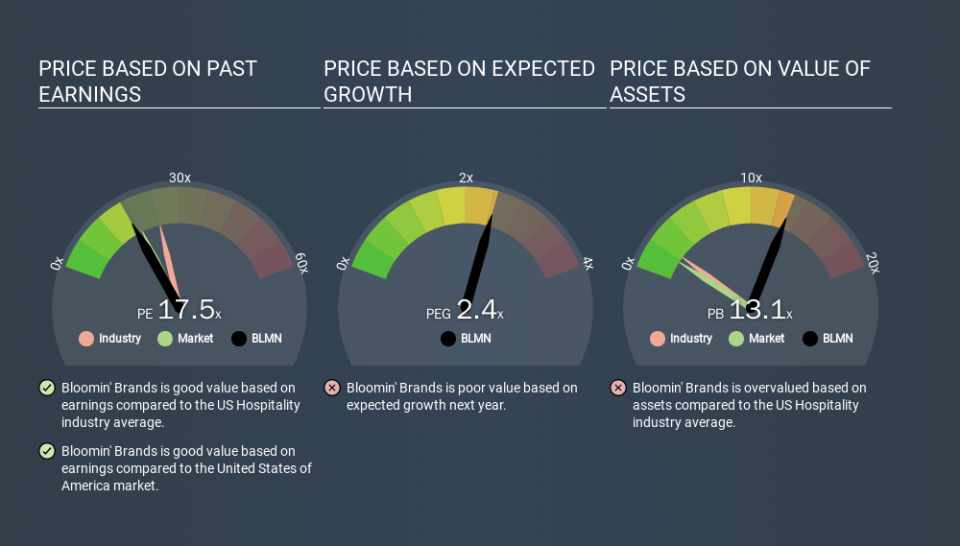
Bloomin' Brands's P/E tells us that market participants think it will not fare as well as its peers in the same industry. Since the market seems unimpressed with Bloomin' Brands, it's quite possible it could surprise on the upside. You should delve deeper. I like to check if company insiders have been buying or selling.
How Growth Rates Impact P/E Ratios
Probably the most important factor in determining what P/E a company trades on is the earnings growth. When earnings grow, the 'E' increases, over time. Therefore, even if you pay a high multiple of earnings now, that multiple will become lower in the future. Then, a lower P/E should attract more buyers, pushing the share price up.
Bloomin' Brands's earnings per share grew by -7.1% in the last twelve months. And its annual EPS growth rate over 5 years is 4.3%.
Remember: P/E Ratios Don't Consider The Balance Sheet
One drawback of using a P/E ratio is that it considers market capitalization, but not the balance sheet. In other words, it does not consider any debt or cash that the company may have on the balance sheet. The exact same company would hypothetically deserve a higher P/E ratio if it had a strong balance sheet, than if it had a weak one with lots of debt, because a cashed up company can spend on growth.
Such spending might be good or bad, overall, but the key point here is that you need to look at debt to understand the P/E ratio in context.
Bloomin' Brands's Balance Sheet
Net debt totals 58% of Bloomin' Brands's market cap. If you want to compare its P/E ratio to other companies, you should absolutely keep in mind it has significant borrowings.
The Bottom Line On Bloomin' Brands's P/E Ratio
Bloomin' Brands's P/E is 17.5 which is below average (18.9) in the US market. While the recent EPS growth is a positive, the significant amount of debt on the balance sheet may be contributing to pessimistic market expectations.
Investors have an opportunity when market expectations about a stock are wrong. As value investor Benjamin Graham famously said, 'In the short run, the market is a voting machine but in the long run, it is a weighing machine. So this free report on the analyst consensus forecasts could help you make a master move on this stock.
Of course you might be able to find a better stock than Bloomin' Brands. So you may wish to see this free collection of other companies that have grown earnings strongly.
If you spot an error that warrants correction, please contact the editor at editorial-team@simplywallst.com. This article by Simply Wall St is general in nature. It does not constitute a recommendation to buy or sell any stock, and does not take account of your objectives, or your financial situation. Simply Wall St has no position in the stocks mentioned.
We aim to bring you long-term focused research analysis driven by fundamental data. Note that our analysis may not factor in the latest price-sensitive company announcements or qualitative material. Thank you for reading.
