Does Booz Allen Hamilton Holding Corporation’s (NYSE:BAH) P/E Ratio Signal A Buying Opportunity?

This article is written for those who want to get better at using price to earnings ratios (P/E ratios). We’ll look at Booz Allen Hamilton Holding Corporation’s (NYSE:BAH) P/E ratio and reflect on what it tells us about the company’s share price. Based on the last twelve months, Booz Allen Hamilton Holding’s P/E ratio is 19.28. That means that at current prices, buyers pay $19.28 for every $1 in trailing yearly profits.
See our latest analysis for Booz Allen Hamilton Holding
How Do I Calculate A Price To Earnings Ratio?
The formula for price to earnings is:
Price to Earnings Ratio = Price per Share ÷ Earnings per Share (EPS)
Or for Booz Allen Hamilton Holding:
P/E of 19.28 = $55.69 ÷ $2.89 (Based on the year to December 2018.)
Is A High P/E Ratio Good?
A higher P/E ratio means that investors are paying a higher price for each $1 of company earnings. That is not a good or a bad thing per se, but a high P/E does imply buyers are optimistic about the future.
How Growth Rates Impact P/E Ratios
Probably the most important factor in determining what P/E a company trades on is the earnings growth. That’s because companies that grow earnings per share quickly will rapidly increase the ‘E’ in the equation. That means even if the current P/E is high, it will reduce over time if the share price stays flat. A lower P/E should indicate the stock is cheap relative to others — and that may attract buyers.
Booz Allen Hamilton Holding increased earnings per share by a whopping 50% last year. And its annual EPS growth rate over 5 years is 9.2%. With that performance, I would expect it to have an above average P/E ratio.
How Does Booz Allen Hamilton Holding’s P/E Ratio Compare To Its Peers?
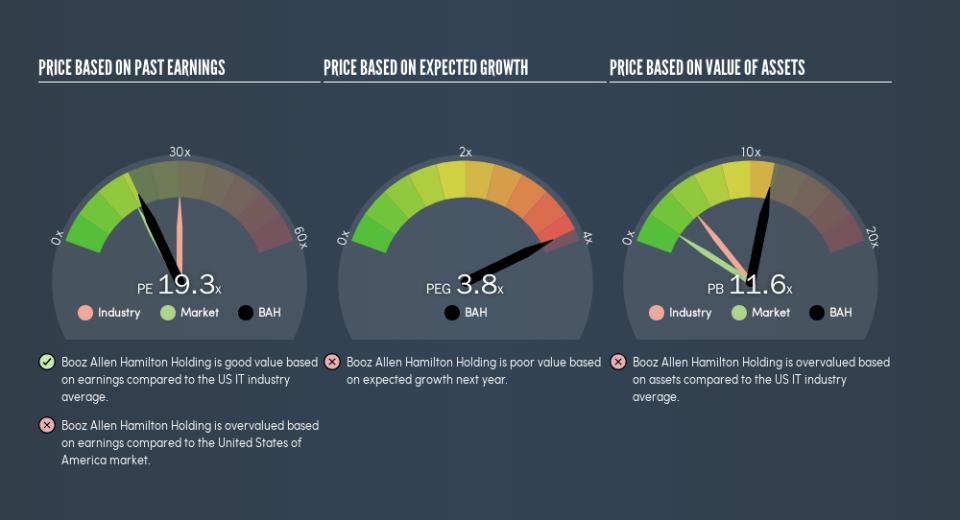
The P/E ratio indicates whether the market has higher or lower expectations of a company. We can see in the image below that the average P/E (30.7) for companies in the it industry is higher than Booz Allen Hamilton Holding’s P/E.
Booz Allen Hamilton Holding’s P/E tells us that market participants think it will not fare as well as its peers in the same industry. While current expectations are low, the stock could be undervalued if the situation is better than the market assumes. If you consider the stock interesting, further research is recommended. For example, I often monitor director buying and selling.
A Limitation: P/E Ratios Ignore Debt and Cash In The Bank
The ‘Price’ in P/E reflects the market capitalization of the company. That means it doesn’t take debt or cash into account. Hypothetically, a company could reduce its future P/E ratio by spending its cash (or taking on debt) to achieve higher earnings.
Such expenditure might be good or bad, in the long term, but the point here is that the balance sheet is not reflected by this ratio.
How Does Booz Allen Hamilton Holding’s Debt Impact Its P/E Ratio?
Booz Allen Hamilton Holding’s net debt is 20% of its market cap. That’s enough debt to impact the P/E ratio a little; so keep it in mind if you’re comparing it to companies without debt.
The Verdict On Booz Allen Hamilton Holding’s P/E Ratio
Booz Allen Hamilton Holding trades on a P/E ratio of 19.3, which is above the US market average of 17.6. While the company does use modest debt, its recent earnings growth is impressive. So it does not seem strange that the P/E is above average.
Investors should be looking to buy stocks that the market is wrong about. If the reality for a company is better than it expects, you can make money by buying and holding for the long term. So this free visualization of the analyst consensus on future earnings could help you make the right decision about whether to buy, sell, or hold.
Of course, you might find a fantastic investment by looking at a few good candidates. So take a peek at this free list of companies with modest (or no) debt, trading on a P/E below 20.
We aim to bring you long-term focused research analysis driven by fundamental data. Note that our analysis may not factor in the latest price-sensitive company announcements or qualitative material.
If you spot an error that warrants correction, please contact the editor at editorial-team@simplywallst.com. This article by Simply Wall St is general in nature. It does not constitute a recommendation to buy or sell any stock, and does not take account of your objectives, or your financial situation. Simply Wall St has no position in the stocks mentioned. Thank you for reading.
