How Does BP Prudhoe Bay Royalty Trust’s (BPT) EPS Growth Stack Up Against Industry Performance?

For investors, increase in profitability and industry-beating performance can be essential considerations in an investment. Below, I will examine BP Prudhoe Bay Royalty Trust’s (NYSE:BPT) track record on a high level, to give you some insight into how the company has been performing against its long term trend and its industry peers. Check out our latest analysis for BP Prudhoe Bay Royalty Trust
Commentary On BPT’s Past Performance
I prefer to use the ‘latest twelve-month’ data, which annualizes the most recent half-year data, or in some cases, the latest annual report is already the most recent financial year data. This technique enables me to examine many different companies in a uniform manner using the most relevant data points. For BP Prudhoe Bay Royalty Trust, the most recent twelve-month earnings is $77M, which, against the prior year’s figure, has jumped by a non-trivial 74.83%. Since these values are relatively myopic, I’ve determined an annualized five-year figure for BPT’s earnings, which stands at $162M. This shows that, despite the fact that earnings growth from last year was positive, over the longer term, BP Prudhoe Bay Royalty Trust’s earnings have been deteriorating on average.
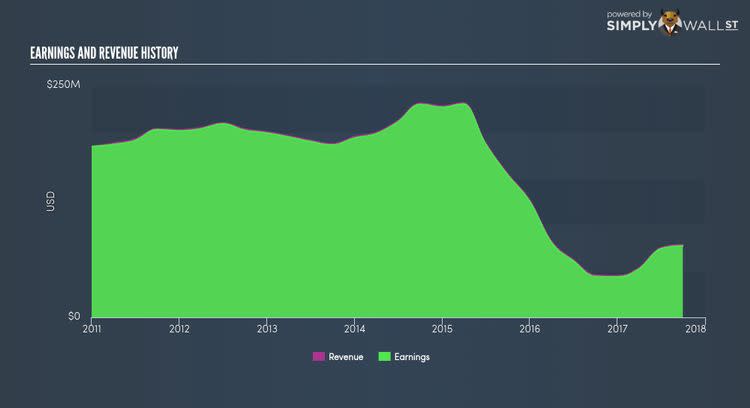
Why is this? Well, let’s take a look at what’s occurring with margins and if the rest of the industry is experiencing the hit as well. Although revenue growth in the last couple of years, has been negative, earnings growth has been falling by even more, suggesting that BP Prudhoe Bay Royalty Trust has been increasing its expenses. This hurts margins and earnings, and is not a sustainable practice. Scanning growth from a sector-level, the US oil, gas and consumable fuels industry has been growing, albeit, at a unexciting single-digit rate of 3.71% in the previous year, . This is a turnaround from a volatile drop of -10.80% in the previous few years. This suggests that any near-term headwind the industry is facing, the impact on BP Prudhoe Bay Royalty Trust has been softer relative to its peers.
What does this mean?
While past data is useful, it doesn’t tell the whole story. Recent positive growth doesn’t necessarily mean it’s onwards and upwards for the company.
I recommend you continue to research BP Prudhoe Bay Royalty Trust to get a more holistic view of the stock by looking at:
1. Financial Health: Is BPT’s operations financially sustainable? Balance sheets can be hard to analyze, which is why we’ve done it for you. Check out our financial health checks here.
2. Valuation: What is BPT worth today? Is the stock undervalued, even when its growth outlook is factored into its intrinsic value? The intrinsic value infographic in our free research report helps visualize whether BPT is currently mispriced by the market.
3. Other High-Performing Stocks: Are there other stocks that provide better prospects with proven track records? Explore our free list of these great stocks here.
NB: Figures in this article are calculated using data from the last twelve months, which refer to the 12-month period ending on the last date of the month the financial statement is dated. This may not be consistent with full year annual report figures.
To help readers see pass the short term volatility of the financial market, we aim to bring you a long-term focused research analysis purely driven by fundamental data. Note that our analysis does not factor in the latest price sensitive company announcements.
The author is an independent contributor and at the time of publication had no position in the stocks mentioned.
