What Does Brambles Limited's (ASX:BXB) P/E Ratio Tell You?

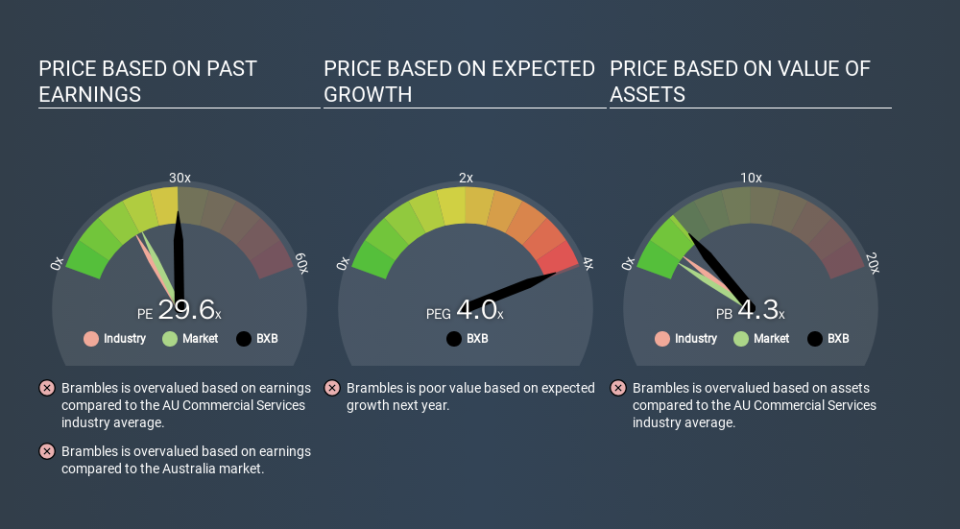
This article is written for those who want to get better at using price to earnings ratios (P/E ratios). We'll show how you can use Brambles Limited's (ASX:BXB) P/E ratio to inform your assessment of the investment opportunity. What is Brambles's P/E ratio? Well, based on the last twelve months it is 29.62. In other words, at today's prices, investors are paying A$29.62 for every A$1 in prior year profit.
View our latest analysis for Brambles
How Do I Calculate Brambles's Price To Earnings Ratio?
The formula for price to earnings is:
Price to Earnings Ratio = Share Price (in reporting currency) ÷ Earnings per Share (EPS)
Or for Brambles:
P/E of 29.62 = USD8.70 (Note: this is the share price in the reporting currency, namely, USD ) ÷ USD0.29 (Based on the year to December 2019.)
Is A High P/E Ratio Good?
A higher P/E ratio implies that investors pay a higher price for the earning power of the business. All else being equal, it's better to pay a low price -- but as Warren Buffett said, 'It's far better to buy a wonderful company at a fair price than a fair company at a wonderful price'.
How Does Brambles's P/E Ratio Compare To Its Peers?
One good way to get a quick read on what market participants expect of a company is to look at its P/E ratio. As you can see below, Brambles has a higher P/E than the average company (16.8) in the commercial services industry.
Its relatively high P/E ratio indicates that Brambles shareholders think it will perform better than other companies in its industry classification. Clearly the market expects growth, but it isn't guaranteed. So further research is always essential. I often monitor director buying and selling.
How Growth Rates Impact P/E Ratios
If earnings fall then in the future the 'E' will be lower. That means unless the share price falls, the P/E will increase in a few years. So while a stock may look cheap based on past earnings, it could be expensive based on future earnings.
Most would be impressed by Brambles earnings growth of 22% in the last year. In contrast, EPS has decreased by 4.9%, annually, over 5 years.
Don't Forget: The P/E Does Not Account For Debt or Bank Deposits
The 'Price' in P/E reflects the market capitalization of the company. That means it doesn't take debt or cash into account. Hypothetically, a company could reduce its future P/E ratio by spending its cash (or taking on debt) to achieve higher earnings.
Such expenditure might be good or bad, in the long term, but the point here is that the balance sheet is not reflected by this ratio.
Is Debt Impacting Brambles's P/E?
Brambles's net debt is 6.1% of its market cap. So it doesn't have as many options as it would with net cash, but its debt would not have much of an impact on its P/E ratio.
The Bottom Line On Brambles's P/E Ratio
Brambles has a P/E of 29.6. That's higher than the average in its market, which is 18.8. Its debt levels do not imperil its balance sheet and it is growing EPS strongly. So on this analysis it seems reasonable that its P/E ratio is above average.
Investors should be looking to buy stocks that the market is wrong about. People often underestimate remarkable growth -- so investors can make money when fast growth is not fully appreciated. So this free visualization of the analyst consensus on future earnings could help you make the right decision about whether to buy, sell, or hold.
But note: Brambles may not be the best stock to buy. So take a peek at this free list of interesting companies with strong recent earnings growth (and a P/E ratio below 20).
If you spot an error that warrants correction, please contact the editor at editorial-team@simplywallst.com. This article by Simply Wall St is general in nature. It does not constitute a recommendation to buy or sell any stock, and does not take account of your objectives, or your financial situation. Simply Wall St has no position in the stocks mentioned.
We aim to bring you long-term focused research analysis driven by fundamental data. Note that our analysis may not factor in the latest price-sensitive company announcements or qualitative material. Thank you for reading.
