Does Carpenter Tan Holdings Limited (HKG:837) Have A Good P/E Ratio?

This article is for investors who would like to improve their understanding of price to earnings ratios (P/E ratios). We’ll show how you can use Carpenter Tan Holdings Limited’s (HKG:837) P/E ratio to inform your assessment of the investment opportunity. Carpenter Tan Holdings has a price to earnings ratio of 9.24, based on the last twelve months. That is equivalent to an earnings yield of about 11%.
Check out our latest analysis for Carpenter Tan Holdings
How Do I Calculate A Price To Earnings Ratio?
The formula for price to earnings is:
Price to Earnings Ratio = Price per Share (in the reporting currency) ÷ Earnings per Share (EPS)
Or for Carpenter Tan Holdings:
P/E of 9.24 = CN¥4.57 (Note: this is the share price in the reporting currency, namely, CNY ) ÷ CN¥0.49 (Based on the year to June 2018.)
Is A High P/E Ratio Good?
A higher P/E ratio means that buyers have to pay a higher price for each HK$1 the company has earned over the last year. That isn’t necessarily good or bad, but a high P/E implies relatively high expectations of what a company can achieve in the future.
How Growth Rates Impact P/E Ratios
P/E ratios primarily reflect market expectations around earnings growth rates. When earnings grow, the ‘E’ increases, over time. That means even if the current P/E is high, it will reduce over time if the share price stays flat. Then, a lower P/E should attract more buyers, pushing the share price up.
Carpenter Tan Holdings’s earnings per share grew by -5.0% in the last twelve months. In contrast, EPS has decreased by 1.5%, annually, over 5 years.
How Does Carpenter Tan Holdings’s P/E Ratio Compare To Its Peers?
The P/E ratio indicates whether the market has higher or lower expectations of a company. If you look at the image below, you can see Carpenter Tan Holdings has a lower P/E than the average (10.5) in the luxury industry classification.
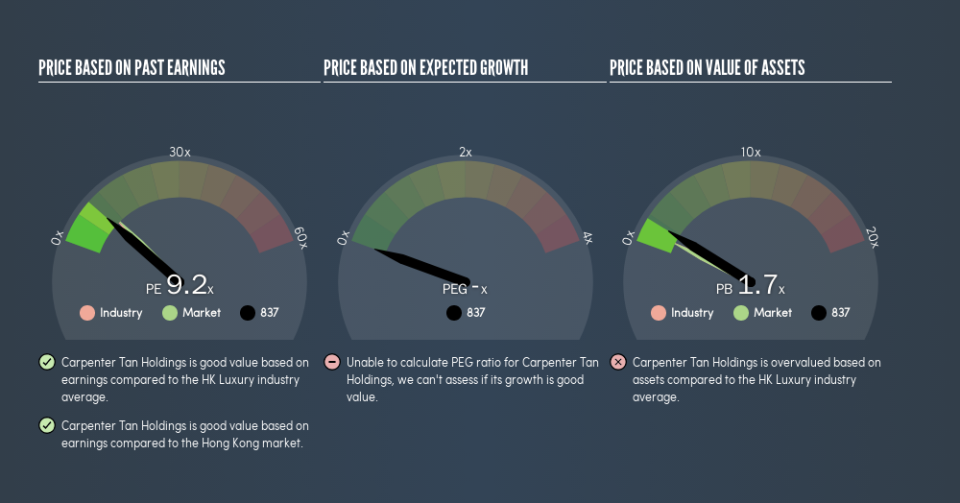
Carpenter Tan Holdings’s P/E tells us that market participants think it will not fare as well as its peers in the same industry. Since the market seems unimpressed with Carpenter Tan Holdings, it’s quite possible it could surprise on the upside. It is arguably worth checking if insiders are buying shares, because that might imply they believe the stock is undervalued.
Remember: P/E Ratios Don’t Consider The Balance Sheet
Don’t forget that the P/E ratio considers market capitalization. In other words, it does not consider any debt or cash that the company may have on the balance sheet. In theory, a company can lower its future P/E ratio by using cash or debt to invest in growth.
Such spending might be good or bad, overall, but the key point here is that you need to look at debt to understand the P/E ratio in context.
Is Debt Impacting Carpenter Tan Holdings’s P/E?
The extra options and safety that comes with Carpenter Tan Holdings’s CN¥283m net cash position means that it deserves a higher P/E than it would if it had a lot of net debt.
The Bottom Line On Carpenter Tan Holdings’s P/E Ratio
Carpenter Tan Holdings’s P/E is 9.2 which is below average (10.9) in the HK market. EPS was up modestly better over the last twelve months. Also positive, the relatively strong balance sheet will allow for investment in growth. In contrast, the P/E indicates shareholders doubt that will happen!
Investors should be looking to buy stocks that the market is wrong about. If it is underestimating a company, investors can make money by buying and holding the shares until the market corrects itself. We don’t have analyst forecasts, but you could get a better understanding of its growth by checking out this more detailed historical graph of earnings, revenue and cash flow.
But note: Carpenter Tan Holdings may not be the best stock to buy. So take a peek at this free list of interesting companies with strong recent earnings growth (and a P/E ratio below 20).
We aim to bring you long-term focused research analysis driven by fundamental data. Note that our analysis may not factor in the latest price-sensitive company announcements or qualitative material.
If you spot an error that warrants correction, please contact the editor at editorial-team@simplywallst.com. This article by Simply Wall St is general in nature. It does not constitute a recommendation to buy or sell any stock, and does not take account of your objectives, or your financial situation. Simply Wall St has no position in the stocks mentioned. Thank you for reading.
