What Does The Chefs’ Warehouse, Inc.’s (NASDAQ:CHEF) P/E Ratio Tell You?

Want to participate in a short research study? Help shape the future of investing tools and receive a $20 prize!
This article is for investors who would like to improve their understanding of price to earnings ratios (P/E ratios). We’ll look at The Chefs’ Warehouse, Inc.’s (NASDAQ:CHEF) P/E ratio and reflect on what it tells us about the company’s share price. Based on the last twelve months, Chefs’ Warehouse’s P/E ratio is 47.86. In other words, at today’s prices, investors are paying $47.86 for every $1 in prior year profit.
See our latest analysis for Chefs’ Warehouse
How Do You Calculate A P/E Ratio?
The formula for price to earnings is:
Price to Earnings Ratio = Share Price ÷ Earnings per Share (EPS)
Or for Chefs’ Warehouse:
P/E of 47.86 = $34.02 ÷ $0.71 (Based on the year to December 2018.)
Is A High Price-to-Earnings Ratio Good?
A higher P/E ratio means that investors are paying a higher price for each $1 of company earnings. All else being equal, it’s better to pay a low price — but as Warren Buffett said, ‘It’s far better to buy a wonderful company at a fair price than a fair company at a wonderful price.’
How Growth Rates Impact P/E Ratios
Earnings growth rates have a big influence on P/E ratios. Earnings growth means that in the future the ‘E’ will be higher. That means even if the current P/E is high, it will reduce over time if the share price stays flat. Then, a lower P/E should attract more buyers, pushing the share price up.
Chefs’ Warehouse increased earnings per share by a whopping 29% last year. And it has improved its earnings per share by 31% per year over the last three years. I’d therefore be a little surprised if its P/E ratio was not relatively high. Unfortunately, earnings per share are down 2.4% a year, over 5 years.
How Does Chefs’ Warehouse’s P/E Ratio Compare To Its Peers?
The P/E ratio essentially measures market expectations of a company. The image below shows that Chefs’ Warehouse has a significantly higher P/E than the average (15.2) P/E for companies in the consumer retailing industry.
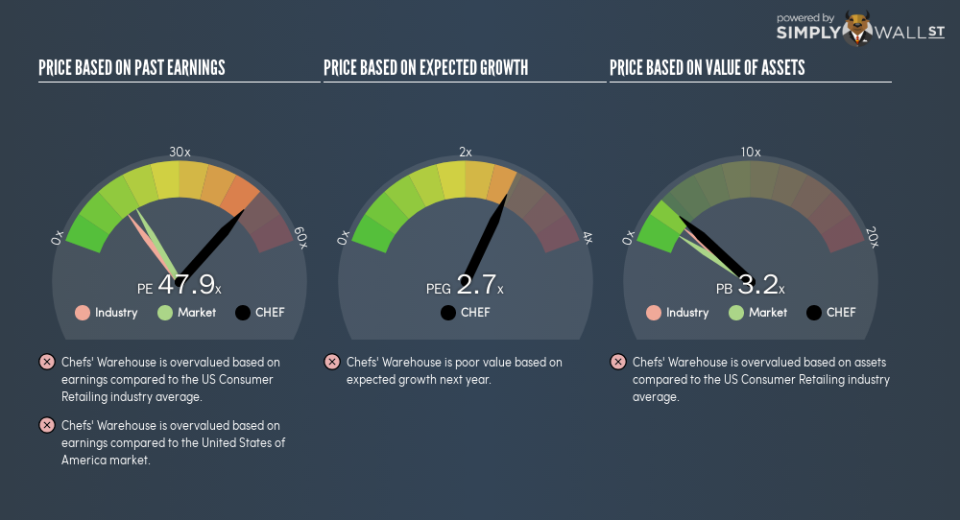
That means that the market expects Chefs’ Warehouse will outperform other companies in its industry. Clearly the market expects growth, but it isn’t guaranteed. So further research is always essential. I often monitor director buying and selling.
Don’t Forget: The P/E Does Not Account For Debt or Bank Deposits
The ‘Price’ in P/E reflects the market capitalization of the company. That means it doesn’t take debt or cash into account. Theoretically, a business can improve its earnings (and produce a lower P/E in the future), by taking on debt (or spending its remaining cash).
Such spending might be good or bad, overall, but the key point here is that you need to look at debt to understand the P/E ratio in context.
Chefs’ Warehouse’s Balance Sheet
Chefs’ Warehouse has net debt worth 23% of its market capitalization. That’s enough debt to impact the P/E ratio a little; so keep it in mind if you’re comparing it to companies without debt.
The Bottom Line On Chefs’ Warehouse’s P/E Ratio
Chefs’ Warehouse’s P/E is 47.9 which is above average (17.2) in the US market. Its debt levels do not imperil its balance sheet and it has already proven it can grow. So it does not seem strange that the P/E is above average.
Investors should be looking to buy stocks that the market is wrong about. As value investor Benjamin Graham famously said, ‘In the short run, the market is a voting machine but in the long run, it is a weighing machine.’ So this free visual report on analyst forecasts could hold they key to an excellent investment decision.
But note: Chefs’ Warehouse may not be the best stock to buy. So take a peek at this free list of interesting companies with strong recent earnings growth (and a P/E ratio below 20).
We aim to bring you long-term focused research analysis driven by fundamental data. Note that our analysis may not factor in the latest price-sensitive company announcements or qualitative material.
If you spot an error that warrants correction, please contact the editor at editorial-team@simplywallst.com. This article by Simply Wall St is general in nature. It does not constitute a recommendation to buy or sell any stock, and does not take account of your objectives, or your financial situation. Simply Wall St has no position in the stocks mentioned. On rare occasion, data errors may occur. Thank you for reading.
