Does China Shenhua Energy Company Limited (HKG:1088) Have A Good P/E Ratio?

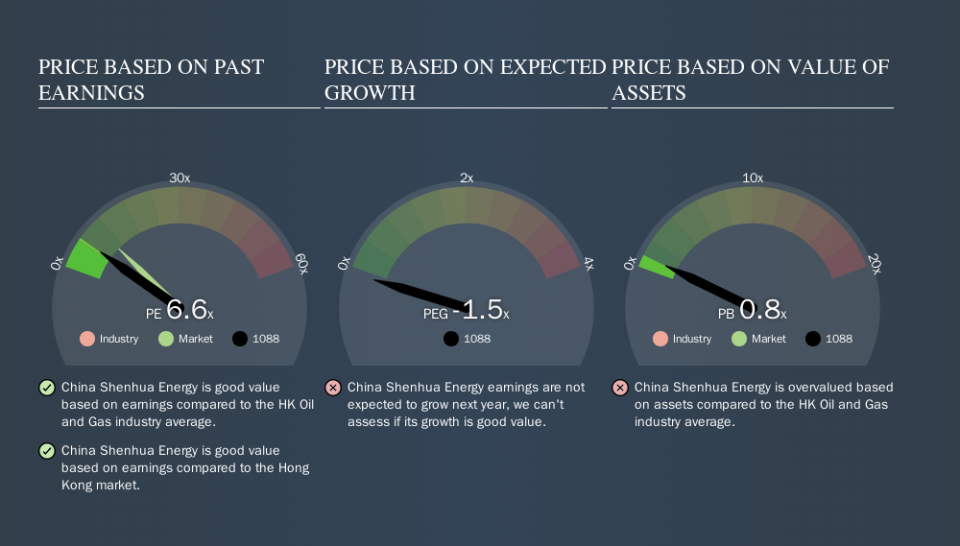
Today, we'll introduce the concept of the P/E ratio for those who are learning about investing. We'll show how you can use China Shenhua Energy Company Limited's (HKG:1088) P/E ratio to inform your assessment of the investment opportunity. What is China Shenhua Energy's P/E ratio? Well, based on the last twelve months it is 6.56. In other words, at today's prices, investors are paying HK$6.56 for every HK$1 in prior year profit.
View our latest analysis for China Shenhua Energy
How Do I Calculate China Shenhua Energy's Price To Earnings Ratio?
The formula for P/E is:
Price to Earnings Ratio = Price per Share (in the reporting currency) ÷ Earnings per Share (EPS)
Or for China Shenhua Energy:
P/E of 6.56 = HK$14.45 (Note: this is the share price in the reporting currency, namely, CNY ) ÷ HK$2.20 (Based on the year to June 2019.)
Is A High P/E Ratio Good?
A higher P/E ratio means that buyers have to pay a higher price for each HK$1 the company has earned over the last year. All else being equal, it's better to pay a low price -- but as Warren Buffett said, 'It's far better to buy a wonderful company at a fair price than a fair company at a wonderful price.
How Does China Shenhua Energy's P/E Ratio Compare To Its Peers?
One good way to get a quick read on what market participants expect of a company is to look at its P/E ratio. As you can see below China Shenhua Energy has a P/E ratio that is fairly close for the average for the oil and gas industry, which is 6.9.
China Shenhua Energy's P/E tells us that market participants think its prospects are roughly in line with its industry. The company could surprise by performing better than average, in the future. I would further inform my view by checking insider buying and selling., among other things.
How Growth Rates Impact P/E Ratios
P/E ratios primarily reflect market expectations around earnings growth rates. That's because companies that grow earnings per share quickly will rapidly increase the 'E' in the equation. That means even if the current P/E is high, it will reduce over time if the share price stays flat. And as that P/E ratio drops, the company will look cheap, unless its share price increases.
China Shenhua Energy saw earnings per share decrease by 4.7% last year. But EPS is up 43% over the last 3 years.
A Limitation: P/E Ratios Ignore Debt and Cash In The Bank
Don't forget that the P/E ratio considers market capitalization. So it won't reflect the advantage of cash, or disadvantage of debt. Hypothetically, a company could reduce its future P/E ratio by spending its cash (or taking on debt) to achieve higher earnings.
While growth expenditure doesn't always pay off, the point is that it is a good option to have; but one that the P/E ratio ignores.
Is Debt Impacting China Shenhua Energy's P/E?
With net cash of CN¥77b, China Shenhua Energy has a very strong balance sheet, which may be important for its business. Having said that, at 21% of its market capitalization the cash hoard would contribute towards a higher P/E ratio.
The Bottom Line On China Shenhua Energy's P/E Ratio
China Shenhua Energy's P/E is 6.6 which is below average (10.4) in the HK market. The recent drop in earnings per share would almost certainly temper expectations, but the net cash position means the company has time to improve: if so, the low P/E could be an opportunity.
When the market is wrong about a stock, it gives savvy investors an opportunity. As value investor Benjamin Graham famously said, 'In the short run, the market is a voting machine but in the long run, it is a weighing machine. So this free visual report on analyst forecasts could hold the key to an excellent investment decision.
You might be able to find a better buy than China Shenhua Energy. If you want a selection of possible winners, check out this free list of interesting companies that trade on a P/E below 20 (but have proven they can grow earnings).
We aim to bring you long-term focused research analysis driven by fundamental data. Note that our analysis may not factor in the latest price-sensitive company announcements or qualitative material.
If you spot an error that warrants correction, please contact the editor at editorial-team@simplywallst.com. This article by Simply Wall St is general in nature. It does not constitute a recommendation to buy or sell any stock, and does not take account of your objectives, or your financial situation. Simply Wall St has no position in the stocks mentioned. Thank you for reading.
