What Does China Strategic Holdings Limited’s (HKG:235) 7.8% ROCE Say About The Business?

Today we'll look at China Strategic Holdings Limited (HKG:235) and reflect on its potential as an investment. In particular, we'll consider its Return On Capital Employed (ROCE), as that can give us insight into how profitably the company is able to employ capital in its business.
First, we'll go over how we calculate ROCE. Then we'll compare its ROCE to similar companies. Then we'll determine how its current liabilities are affecting its ROCE.
What is Return On Capital Employed (ROCE)?
ROCE is a metric for evaluating how much pre-tax income (in percentage terms) a company earns on the capital invested in its business. Generally speaking a higher ROCE is better. Ultimately, it is a useful but imperfect metric. Author Edwin Whiting says to be careful when comparing the ROCE of different businesses, since 'No two businesses are exactly alike.
So, How Do We Calculate ROCE?
Analysts use this formula to calculate return on capital employed:
Return on Capital Employed = Earnings Before Interest and Tax (EBIT) ÷ (Total Assets - Current Liabilities)
Or for China Strategic Holdings:
0.078 = HK$393m ÷ (HK$5.9b - HK$842m) (Based on the trailing twelve months to June 2019.)
So, China Strategic Holdings has an ROCE of 7.8%.
See our latest analysis for China Strategic Holdings
Does China Strategic Holdings Have A Good ROCE?
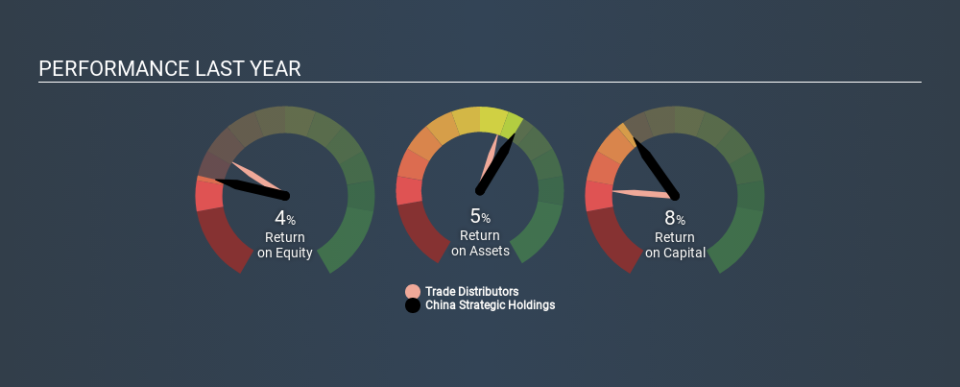
ROCE is commonly used for comparing the performance of similar businesses. Using our data, China Strategic Holdings's ROCE appears to be around the 6.9% average of the Trade Distributors industry. Separate from how China Strategic Holdings stacks up against its industry, its ROCE in absolute terms is mediocre; relative to the returns on government bonds. Investors may wish to consider higher-performing investments.
We can see that, China Strategic Holdings currently has an ROCE of 7.8% compared to its ROCE 3 years ago, which was 1.7%. This makes us think about whether the company has been reinvesting shrewdly. You can see in the image below how China Strategic Holdings's ROCE compares to its industry. Click to see more on past growth.
It is important to remember that ROCE shows past performance, and is not necessarily predictive. ROCE can be deceptive for cyclical businesses, as returns can look incredible in boom times, and terribly low in downturns. ROCE is, after all, simply a snap shot of a single year. You can check if China Strategic Holdings has cyclical profits by looking at this free graph of past earnings, revenue and cash flow.
China Strategic Holdings's Current Liabilities And Their Impact On Its ROCE
Short term (or current) liabilities, are things like supplier invoices, overdrafts, or tax bills that need to be paid within 12 months. The ROCE equation subtracts current liabilities from capital employed, so a company with a lot of current liabilities appears to have less capital employed, and a higher ROCE than otherwise. To counter this, investors can check if a company has high current liabilities relative to total assets.
China Strategic Holdings has total assets of HK$5.9b and current liabilities of HK$842m. As a result, its current liabilities are equal to approximately 14% of its total assets. This is a modest level of current liabilities, which would only have a small effect on ROCE.
What We Can Learn From China Strategic Holdings's ROCE
That said, China Strategic Holdings's ROCE is mediocre, there may be more attractive investments around. Of course, you might find a fantastic investment by looking at a few good candidates. So take a peek at this free list of companies with modest (or no) debt, trading on a P/E below 20.
I will like China Strategic Holdings better if I see some big insider buys. While we wait, check out this free list of growing companies with considerable, recent, insider buying.
If you spot an error that warrants correction, please contact the editor at editorial-team@simplywallst.com. This article by Simply Wall St is general in nature. It does not constitute a recommendation to buy or sell any stock, and does not take account of your objectives, or your financial situation. Simply Wall St has no position in the stocks mentioned.
We aim to bring you long-term focused research analysis driven by fundamental data. Note that our analysis may not factor in the latest price-sensitive company announcements or qualitative material. Thank you for reading.
