How Does Class's (ASX:CL1) P/E Compare To Its Industry, After Its Big Share Price Gain?

It's great to see Class (ASX:CL1) shareholders have their patience rewarded with a 32% share price pop in the last month. However, the annual gain of 3.9% wasn't so impressive.
Assuming no other changes, a sharply higher share price makes a stock less attractive to potential buyers. While the market sentiment towards a stock is very changeable, in the long run, the share price will tend to move in the same direction as earnings per share. The implication here is that deep value investors might steer clear when expectations of a company are too high. Perhaps the simplest way to get a read on investors' expectations of a business is to look at its Price to Earnings Ratio (PE Ratio). A high P/E ratio means that investors have a high expectation about future growth, while a low P/E ratio means they have low expectations about future growth.
View our latest analysis for Class
Does Class Have A Relatively High Or Low P/E For Its Industry?
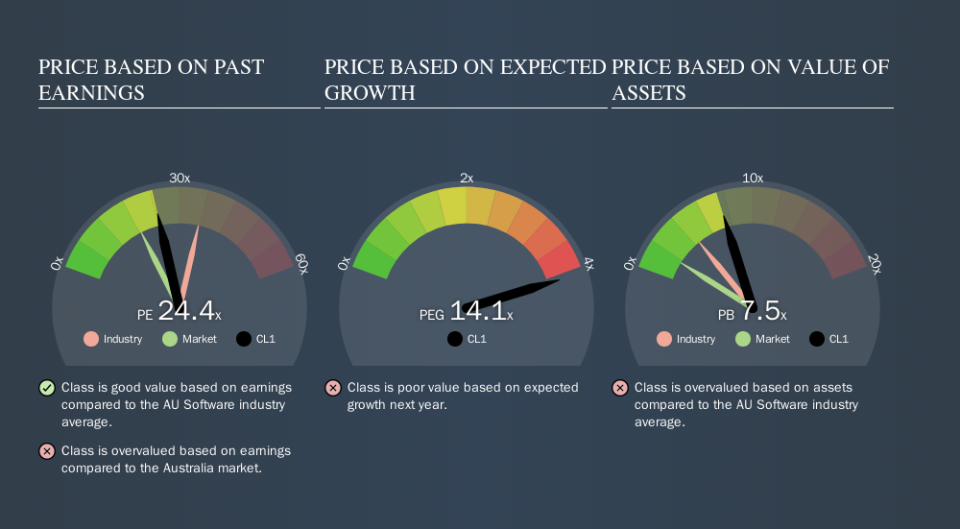
We can tell from its P/E ratio of 24.41 that sentiment around Class isn't particularly high. If you look at the image below, you can see Class has a lower P/E than the average (35.5) in the software industry classification.
Class's P/E tells us that market participants think it will not fare as well as its peers in the same industry. Since the market seems unimpressed with Class, it's quite possible it could surprise on the upside. If you consider the stock interesting, further research is recommended. For example, I often monitor director buying and selling.
How Growth Rates Impact P/E Ratios
Generally speaking the rate of earnings growth has a profound impact on a company's P/E multiple. When earnings grow, the 'E' increases, over time. And in that case, the P/E ratio itself will drop rather quickly. Then, a lower P/E should attract more buyers, pushing the share price up.
Class increased earnings per share by 3.6% last year. And earnings per share have improved by 18% annually, over the last three years.
Remember: P/E Ratios Don't Consider The Balance Sheet
One drawback of using a P/E ratio is that it considers market capitalization, but not the balance sheet. That means it doesn't take debt or cash into account. In theory, a company can lower its future P/E ratio by using cash or debt to invest in growth.
Such expenditure might be good or bad, in the long term, but the point here is that the balance sheet is not reflected by this ratio.
So What Does Class's Balance Sheet Tell Us?
Class has net cash of AU$17m. That should lead to a higher P/E than if it did have debt, because its strong balance sheets gives it more options.
The Bottom Line On Class's P/E Ratio
Class has a P/E of 24.4. That's higher than the average in its market, which is 18.5. Recent earnings growth wasn't bad. Also positive, the relatively strong balance sheet will allow for investment in growth -- and the P/E indicates shareholders that will happen! What we know for sure is that investors have become much more excited about Class recently, since they have pushed its P/E ratio from 18.5 to 24.4 over the last month. If you like to buy stocks that have recently impressed the market, then this one might be a candidate; but if you prefer to invest when there is 'blood in the streets', then you may feel the opportunity has passed.
When the market is wrong about a stock, it gives savvy investors an opportunity. If the reality for a company is better than it expects, you can make money by buying and holding for the long term. So this free visualization of the analyst consensus on future earnings could help you make the right decision about whether to buy, sell, or hold.
You might be able to find a better buy than Class. If you want a selection of possible winners, check out this free list of interesting companies that trade on a P/E below 20 (but have proven they can grow earnings).
We aim to bring you long-term focused research analysis driven by fundamental data. Note that our analysis may not factor in the latest price-sensitive company announcements or qualitative material.
If you spot an error that warrants correction, please contact the editor at editorial-team@simplywallst.com. This article by Simply Wall St is general in nature. It does not constitute a recommendation to buy or sell any stock, and does not take account of your objectives, or your financial situation. Simply Wall St has no position in the stocks mentioned. Thank you for reading.