What does Cypress Energy Partners LP’s (NYSE:CELP) Balance Sheet Tell Us About Its Future?

While small-cap stocks, such as Cypress Energy Partners LP (NYSE:CELP) with its market cap of US$94.39m, are popular for their explosive growth, investors should also be aware of their balance sheet to judge whether the company can survive a downturn. So, understanding the company’s financial health becomes vital, since poor capital management may bring about bankruptcies, which occur at a higher rate for small-caps. I believe these basic checks tell most of the story you need to know. Though, since I only look at basic financial figures, I recommend you dig deeper yourself into CELP here.
Does CELP produce enough cash relative to debt?
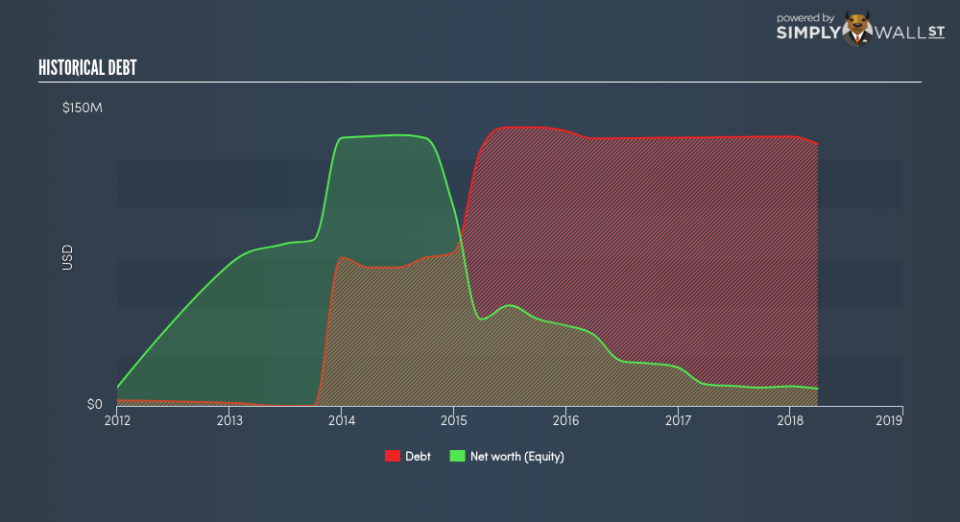
Over the past year, CELP has maintained its debt levels at around US$136.29m comprising of short- and long-term debt. At this stable level of debt, CELP’s cash and short-term investments stands at US$24.51m , ready to deploy into the business. Moreover, CELP has produced US$8.25m in operating cash flow in the last twelve months, resulting in an operating cash to total debt ratio of 6.06%, signalling that CELP’s debt is not appropriately covered by operating cash. This ratio can also be interpreted as a measure of efficiency as an alternative to return on assets. In CELP’s case, it is able to generate 0.061x cash from its debt capital.
Can CELP pay its short-term liabilities?
Looking at CELP’s most recent US$153.08m liabilities, it seems that the business is not able to meet these obligations given the level of current assets of US$70.67m, with a current ratio of 0.46x below the prudent level of 3x.
Is CELP’s debt level acceptable?
Since total debt levels have outpaced equities, CELP is a highly leveraged company. This is not uncommon for a small-cap company given that debt tends to be lower-cost and at times, more accessible. We can test if CELP’s debt levels are sustainable by measuring interest payments against earnings of a company. Ideally, earnings before interest and tax (EBIT) should cover net interest by at least three times. For CELP, the ratio of 1.27x suggests that interest is not strongly covered, which means that lenders may refuse to lend the company more money, as it is seen as too risky in terms of default.
Next Steps:
CELP’s high debt level indicates room for improvement. Furthermore, its cash flow coverage of less than a quarter of debt means that operating efficiency could also be an issue. In addition to this, its lack of liquidity raises questions over current asset management practices for the small-cap. This is only a rough assessment of financial health, and I’m sure CELP has company-specific issues impacting its capital structure decisions. I suggest you continue to research Cypress Energy Partners to get a more holistic view of the stock by looking at:
Valuation: What is CELP worth today? Is the stock undervalued, even when its growth outlook is factored into its intrinsic value? The intrinsic value infographic in our free research report helps visualize whether CELP is currently mispriced by the market.
Historical Performance: What has CELP’s returns been like over the past? Go into more detail in the past track record analysis and take a look at the free visual representations of our analysis for more clarity.
Other High-Performing Stocks: Are there other stocks that provide better prospects with proven track records? Explore our free list of these great stocks here.
To help readers see pass the short term volatility of the financial market, we aim to bring you a long-term focused research analysis purely driven by fundamental data. Note that our analysis does not factor in the latest price sensitive company announcements.
The author is an independent contributor and at the time of publication had no position in the stocks mentioned.
