Does Diversified Royalty Corp.'s (TSE:DIV) Weak Fundamentals Mean That The Stock Could Move In The Opposite Direction?
Diversified Royalty's (TSE:DIV) stock is up by 7.6% over the past three months. Given that the markets usually pay for the long-term financial health of a company, we wonder if the current momentum in the share price will keep up, given that the company's financials don't look very promising. Particularly, we will be paying attention to Diversified Royalty's ROE today.
Return on equity or ROE is an important factor to be considered by a shareholder because it tells them how effectively their capital is being reinvested. In simpler terms, it measures the profitability of a company in relation to shareholder's equity.
See our latest analysis for Diversified Royalty
How Do You Calculate Return On Equity?
The formula for return on equity is:
Return on Equity = Net Profit (from continuing operations) ÷ Shareholders' Equity
So, based on the above formula, the ROE for Diversified Royalty is:
3.7% = CA$7.0m ÷ CA$189m (Based on the trailing twelve months to March 2021).
The 'return' is the profit over the last twelve months. So, this means that for every CA$1 of its shareholder's investments, the company generates a profit of CA$0.04.
What Has ROE Got To Do With Earnings Growth?
Thus far, we have learned that ROE measures how efficiently a company is generating its profits. Based on how much of its profits the company chooses to reinvest or "retain", we are then able to evaluate a company's future ability to generate profits. Assuming all else is equal, companies that have both a higher return on equity and higher profit retention are usually the ones that have a higher growth rate when compared to companies that don't have the same features.
A Side By Side comparison of Diversified Royalty's Earnings Growth And 3.7% ROE
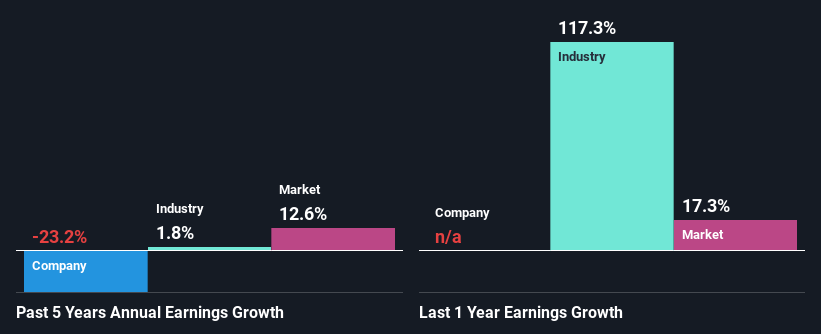
At first glance, Diversified Royalty's ROE doesn't look very promising. A quick further study shows that the company's ROE doesn't compare favorably to the industry average of 17% either. For this reason, Diversified Royalty's five year net income decline of 23% is not surprising given its lower ROE. We reckon that there could also be other factors at play here. For example, it is possible that the business has allocated capital poorly or that the company has a very high payout ratio.
That being said, we compared Diversified Royalty's performance with the industry and were concerned when we found that while the company has shrunk its earnings, the industry has grown its earnings at a rate of 1.8% in the same period.
Earnings growth is an important metric to consider when valuing a stock. The investor should try to establish if the expected growth or decline in earnings, whichever the case may be, is priced in. Doing so will help them establish if the stock's future looks promising or ominous. Has the market priced in the future outlook for DIV? You can find out in our latest intrinsic value infographic research report.
Is Diversified Royalty Making Efficient Use Of Its Profits?
Diversified Royalty's high three-year median payout ratio of 194% suggests that the company is depleting its resources to keep up its dividend payments, and this shows in its shrinking earnings. Paying a dividend higher than reported profits is not a sustainable move. Our risks dashboard should have the 4 risks we have identified for Diversified Royalty.
In addition, Diversified Royalty has been paying dividends over a period of seven years suggesting that keeping up dividend payments is preferred by the management even though earnings have been in decline.
Conclusion
In total, we would have a hard think before deciding on any investment action concerning Diversified Royalty. Particularly, its ROE is a huge disappointment, not to mention its lack of proper reinvestment into the business. As a result its earnings growth has also been quite disappointing. Until now, we have only just grazed the surface of the company's past performance by looking at the company's fundamentals. To gain further insights into Diversified Royalty's past profit growth, check out this visualization of past earnings, revenue and cash flows.
This article by Simply Wall St is general in nature. It does not constitute a recommendation to buy or sell any stock, and does not take account of your objectives, or your financial situation. We aim to bring you long-term focused analysis driven by fundamental data. Note that our analysis may not factor in the latest price-sensitive company announcements or qualitative material. Simply Wall St has no position in any stocks mentioned.
Have feedback on this article? Concerned about the content? Get in touch with us directly. Alternatively, email editorial-team (at) simplywallst.com.
