Does Empire Company Limited’s (TSE:EMP.A) Debt Level Pose A Problem?

Small-cap and large-cap companies receive a lot of attention from investors, but mid-cap stocks like Empire Company Limited (TSX:EMP.A), with a market cap of CA$6.10B, are often out of the spotlight. Surprisingly though, when accounted for risk, mid-caps have delivered better returns compared to the two other categories of stocks. Let’s take a look at EMP.A’s debt concentration and assess their financial liquidity to get an idea of their ability to fund strategic acquisitions and grow through cyclical pressures. Don’t forget that this is a general and concentrated examination of Amazon’s financial health, so you should conduct further analysis into EMP.A here. View our latest analysis for Empire
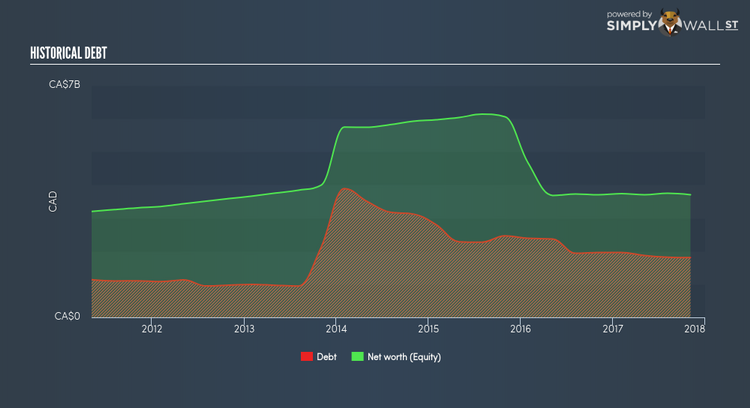
Does EMP.A generate enough cash through operations?
EMP.A has shrunken its total debt levels in the last twelve months, from CA$2.37B to CA$1.87B , which is made up of current and long term debt. With this reduction in debt, EMP.A’s cash and short-term investments stands at CA$207.30M , ready to deploy into the business. Additionally, EMP.A has produced CA$708.50M in operating cash flow in the last twelve months, leading to an operating cash to total debt ratio of 37.87%, indicating that EMP.A’s debt is appropriately covered by operating cash. This ratio can also be interpreted as a measure of efficiency as an alternative to return on assets. In EMP.A’s case, it is able to generate 0.38x cash from its debt capital.
Can EMP.A meet its short-term obligations with the cash in hand?
With current liabilities at CA$2.49B, it appears that the company is not able to meet these obligations given the level of current assets of CA$2.17B, with a current ratio of 0.87x below the prudent level of 3x.
Can EMP.A service its debt comfortably?
With debt reaching 48.68% of equity, EMP.A may be thought of as relatively highly levered. This is not uncommon for a mid-cap company given that debt tends to be lower-cost and at times, more accessible. We can check to see whether EMP.A is able to meet its debt obligations by looking at the net interest coverage ratio. A company generating earnings before interest and tax (EBIT) at least three times its net interest payments is considered financially sound. In EMP.A’s, case, the ratio of 3.95x suggests that interest is appropriately covered, which means that lenders may be less hesitant to lend out more funding as EMP.A’s high interest coverage is seen as responsible and safe practice.
Next Steps:
Although EMP.A’s debt level is towards the higher end of the spectrum, its cash flow coverage seems adequate to meet debt obligations which means its debt is being efficiently utilised. But, its lack of liquidity raises questions over current asset management practices for the mid-cap. I admit this is a fairly basic analysis for EMP.A’s financial health. Other important fundamentals need to be considered alongside. I recommend you continue to research Empire to get a better picture of the stock by looking at:
1. Valuation: What is EMP.A worth today? Is the stock undervalued, even when its growth outlook is factored into its intrinsic value? The intrinsic value infographic in our free research report helps visualize whether EMP.A is currently mispriced by the market.
2. Historical Performance: What has EMP.A’s returns been like over the past? Go into more detail in the past track record analysis and take a look at the free visual representations of our analysis for more clarity.
3. Other High-Performing Stocks: Are there other stocks that provide better prospects with proven track records? Explore our free list of these great stocks here.
To help readers see pass the short term volatility of the financial market, we aim to bring you a long-term focused research analysis purely driven by fundamental data. Note that our analysis does not factor in the latest price sensitive company announcements.
The author is an independent contributor and at the time of publication had no position in the stocks mentioned.
