What does EnerSys's (NYSE:ENS) Balance Sheet Tell Us About Its Future?

Want to participate in a short research study? Help shape the future of investing tools and you could win a $250 gift card!
Small-caps and large-caps are wildly popular among investors, however, mid-cap stocks, such as EnerSys (NYSE:ENS), with a market capitalization of US$2.9b, rarely draw their attention from the investing community. Despite this, the two other categories have lagged behind the risk-adjusted returns of commonly ignored mid-cap stocks. Today we will look at ENS’s financial liquidity and debt levels, which are strong indicators for whether the company can weather economic downturns or fund strategic acquisitions for future growth. Note that this information is centred entirely on financial health and is a top-level understanding, so I encourage you to look further into ENS here.
Check out our latest analysis for EnerSys
ENS’s Debt (And Cash Flows)
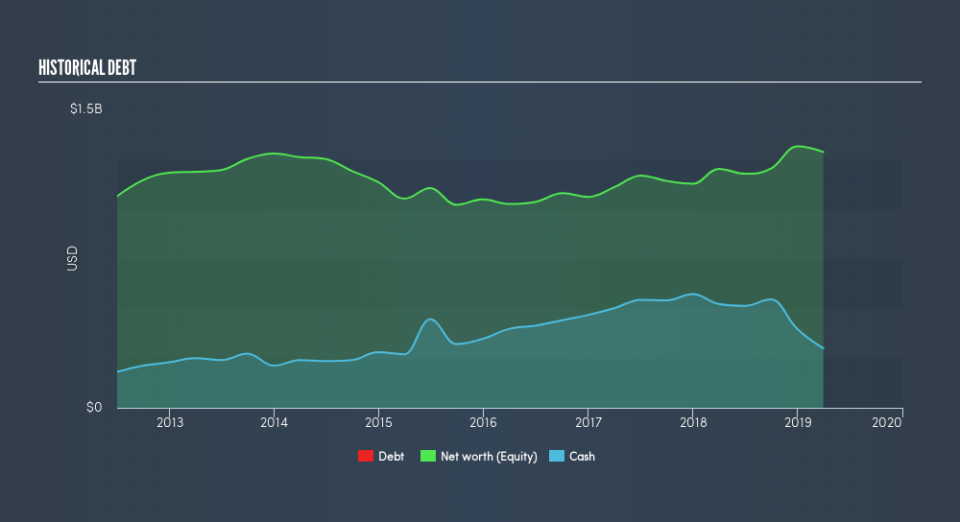
ENS has built up its total debt levels in the last twelve months, from US$598m to US$1.0b , which includes long-term debt. With this increase in debt, ENS currently has US$299m remaining in cash and short-term investments to keep the business going. Additionally, ENS has produced cash from operations of US$198m during the same period of time, leading to an operating cash to total debt ratio of 19%, meaning that ENS’s operating cash is less than its debt.
Can ENS meet its short-term obligations with the cash in hand?
At the current liabilities level of US$613m, it seems that the business has been able to meet these obligations given the level of current assets of US$1.5b, with a current ratio of 2.51x. The current ratio is the number you get when you divide current assets by current liabilities. For Electrical companies, this ratio is within a sensible range as there's enough of a cash buffer without holding too much capital in low return investments.
Does ENS face the risk of succumbing to its debt-load?
With a debt-to-equity ratio of 81%, ENS can be considered as an above-average leveraged company. This is not unusual for mid-caps as debt tends to be a cheaper and faster source of funding for some businesses. No matter how high the company’s debt, if it can easily cover the interest payments, it’s considered to be efficient with its use of excess leverage. A company generating earnings after interest and tax at least three times its net interest payments is considered financially sound. In ENS's case, the ratio of 8.86x suggests that interest is appropriately covered, which means that debtors may be willing to loan the company more money, giving ENS ample headroom to grow its debt facilities.
Next Steps:
ENS’s high cash coverage means that, although its debt levels are high, the company is able to utilise its borrowings efficiently in order to generate cash flow. This may mean this is an optimal capital structure for the business, given that it is also meeting its short-term commitment. This is only a rough assessment of financial health, and I'm sure ENS has company-specific issues impacting its capital structure decisions. You should continue to research EnerSys to get a better picture of the mid-cap by looking at:
Future Outlook: What are well-informed industry analysts predicting for ENS’s future growth? Take a look at our free research report of analyst consensus for ENS’s outlook.
Valuation: What is ENS worth today? Is the stock undervalued, even when its growth outlook is factored into its intrinsic value? The intrinsic value infographic in our free research report helps visualize whether ENS is currently mispriced by the market.
Other High-Performing Stocks: Are there other stocks that provide better prospects with proven track records? Explore our free list of these great stocks here.
We aim to bring you long-term focused research analysis driven by fundamental data. Note that our analysis may not factor in the latest price-sensitive company announcements or qualitative material.
If you spot an error that warrants correction, please contact the editor at editorial-team@simplywallst.com. This article by Simply Wall St is general in nature. It does not constitute a recommendation to buy or sell any stock, and does not take account of your objectives, or your financial situation. Simply Wall St has no position in the stocks mentioned. Thank you for reading.
