Does The First of Long Island Corporation’s (NASDAQ:FLIC) P/E Ratio Signal A Buying Opportunity?

Want to participate in a short research study? Help shape the future of investing tools and you could win a $250 gift card!
This article is written for those who want to get better at using price to earnings ratios (P/E ratios). We’ll show how you can use The First of Long Island Corporation’s (NASDAQ:FLIC) P/E ratio to inform your assessment of the investment opportunity. Based on the last twelve months, First of Long Island’s P/E ratio is 13.19. That is equivalent to an earnings yield of about 7.6%.
See our latest analysis for First of Long Island
How Do You Calculate A P/E Ratio?
The formula for P/E is:
Price to Earnings Ratio = Price per Share ÷ Earnings per Share (EPS)
Or for First of Long Island:
P/E of 13.19 = $21.62 ÷ $1.64 (Based on the trailing twelve months to December 2018.)
Is A High Price-to-Earnings Ratio Good?
A higher P/E ratio implies that investors pay a higher price for the earning power of the business. That isn’t a good or a bad thing on its own, but a high P/E means that buyers have a higher opinion of the business’s prospects, relative to stocks with a lower P/E.
How Growth Rates Impact P/E Ratios
Probably the most important factor in determining what P/E a company trades on is the earnings growth. Earnings growth means that in the future the ‘E’ will be higher. That means even if the current P/E is high, it will reduce over time if the share price stays flat. So while a stock may look expensive based on past earnings, it could be cheap based on future earnings.
First of Long Island increased earnings per share by an impressive 13% over the last twelve months. And earnings per share have improved by 9.1% annually, over the last five years. This could arguably justify a relatively high P/E ratio.
How Does First of Long Island’s P/E Ratio Compare To Its Peers?
The P/E ratio indicates whether the market has higher or lower expectations of a company. The image below shows that First of Long Island has a P/E ratio that is roughly in line with the banks industry average (13.3).
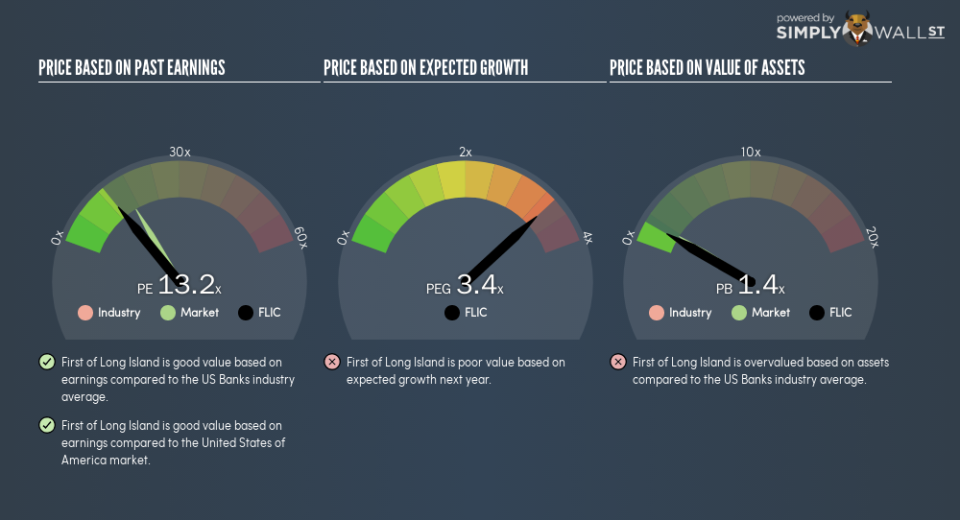
First of Long Island’s P/E tells us that market participants think its prospects are roughly in line with its industry. The company could surprise by performing better than average, in the future. Checking factors such as the tenure of the board and management could help you form your own view on if that will happen.
A Limitation: P/E Ratios Ignore Debt and Cash In The Bank
The ‘Price’ in P/E reflects the market capitalization of the company. That means it doesn’t take debt or cash into account. In theory, a company can lower its future P/E ratio by using cash or debt to invest in growth.
Such spending might be good or bad, overall, but the key point here is that you need to look at debt to understand the P/E ratio in context.
How Does First of Long Island’s Debt Impact Its P/E Ratio?
First of Long Island’s net debt is considerable, at 128% of its market cap. This is a relatively high level of debt, so the stock probably deserves a relatively low P/E ratio. Keep that in mind when comparing it to other companies.
The Bottom Line On First of Long Island’s P/E Ratio
First of Long Island’s P/E is 13.2 which is below average (16.8) in the US market. The company has a meaningful amount of debt on the balance sheet, but that should not eclipse the solid earnings growth. The low P/E ratio suggests current market expectations are muted, implying these levels of growth will not continue.
Investors should be looking to buy stocks that the market is wrong about. If it is underestimating a company, investors can make money by buying and holding the shares until the market corrects itself. So this free visual report on analyst forecasts could hold they key to an excellent investment decision.
But note: First of Long Island may not be the best stock to buy. So take a peek at this free list of interesting companies with strong recent earnings growth (and a P/E ratio below 20).
To help readers see past the short term volatility of the financial market, we aim to bring you a long-term focused research analysis purely driven by fundamental data. Note that our analysis does not factor in the latest price-sensitive company announcements.
The author is an independent contributor and at the time of publication had no position in the stocks mentioned. For errors that warrant correction please contact the editor at editorial-team@simplywallst.com.
