Does First Savings Financial Group, Inc.'s (NASDAQ:FSFG) P/E Ratio Signal A Buying Opportunity?

First Savings Financial Group (NASDAQ:FSFG) shares have retraced a considerable in the last month. But there's still good reason for shareholders to be content; the stock has gained 14% in the last 90 days. The stock has been solid, longer term, gaining 18% in the last year.
Assuming no other changes, a sharply higher share price makes a stock less attractive to potential buyers. In the long term, share prices tend to follow earnings per share, but in the short term prices bounce around in response to short term factors (which are not always obvious). So some would prefer to hold off buying when there is a lot of optimism towards a stock. One way to gauge market expectations of a stock is to look at its Price to Earnings Ratio (PE Ratio). Investors have optimistic expectations of companies with higher P/E ratios, compared to companies with lower P/E ratios.
Check out our latest analysis for First Savings Financial Group
How Does First Savings Financial Group's P/E Ratio Compare To Its Peers?
We can tell from its P/E ratio of 9.63 that sentiment around First Savings Financial Group isn't particularly high. If you look at the image below, you can see First Savings Financial Group has a lower P/E than the average (12.7) in the banks industry classification.
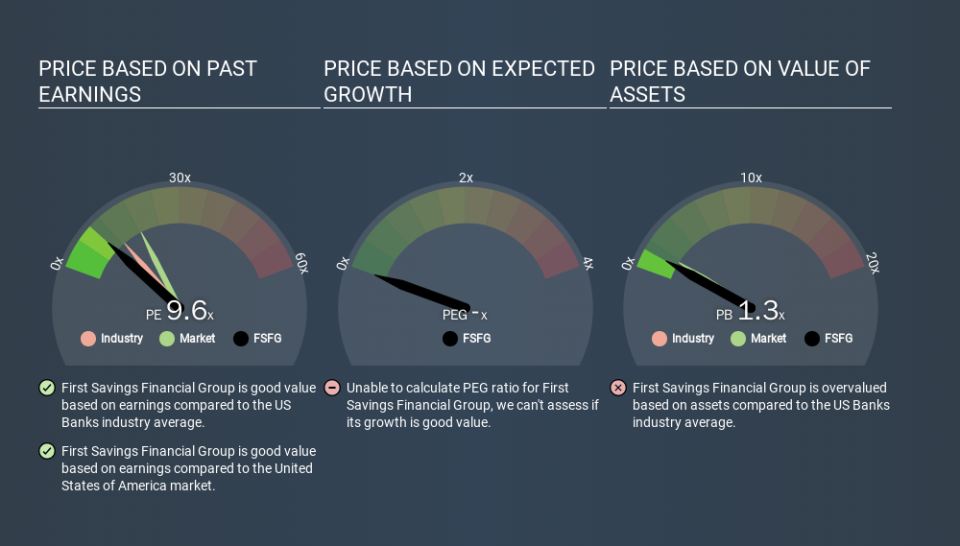
This suggests that market participants think First Savings Financial Group will underperform other companies in its industry. Since the market seems unimpressed with First Savings Financial Group, it's quite possible it could surprise on the upside. If you consider the stock interesting, further research is recommended. For example, I often monitor director buying and selling.
How Growth Rates Impact P/E Ratios
P/E ratios primarily reflect market expectations around earnings growth rates. That's because companies that grow earnings per share quickly will rapidly increase the 'E' in the equation. That means unless the share price increases, the P/E will reduce in a few years. So while a stock may look expensive based on past earnings, it could be cheap based on future earnings.
First Savings Financial Group increased earnings per share by a whopping 45% last year. And its annual EPS growth rate over 5 years is 23%. I'd therefore be a little surprised if its P/E ratio was not relatively high.
Remember: P/E Ratios Don't Consider The Balance Sheet
Don't forget that the P/E ratio considers market capitalization. So it won't reflect the advantage of cash, or disadvantage of debt. In theory, a company can lower its future P/E ratio by using cash or debt to invest in growth.
While growth expenditure doesn't always pay off, the point is that it is a good option to have; but one that the P/E ratio ignores.
Is Debt Impacting First Savings Financial Group's P/E?
First Savings Financial Group's net debt is considerable, at 117% of its market cap. This level of debt justifies a relatively low P/E, so remain cognizant of the debt, if you're comparing it to other stocks.
The Bottom Line On First Savings Financial Group's P/E Ratio
First Savings Financial Group trades on a P/E ratio of 9.6, which is below the US market average of 18.5. The company may have significant debt, but EPS growth was good last year. The low P/E ratio suggests current market expectations are muted, implying these levels of growth will not continue. What can be absolutely certain is that the market has become more pessimistic about First Savings Financial Group over the last month, with the P/E ratio falling from 9.6 back then to 9.6 today. For those who prefer to invest with the flow of momentum, that might be a bad sign, but for deep value investors this stock might justify some research.
Investors have an opportunity when market expectations about a stock are wrong. If it is underestimating a company, investors can make money by buying and holding the shares until the market corrects itself. So this free visualization of the analyst consensus on future earnings could help you make the right decision about whether to buy, sell, or hold.
Of course, you might find a fantastic investment by looking at a few good candidates. So take a peek at this free list of companies with modest (or no) debt, trading on a P/E below 20.
If you spot an error that warrants correction, please contact the editor at editorial-team@simplywallst.com. This article by Simply Wall St is general in nature. It does not constitute a recommendation to buy or sell any stock, and does not take account of your objectives, or your financial situation. Simply Wall St has no position in the stocks mentioned.
We aim to bring you long-term focused research analysis driven by fundamental data. Note that our analysis may not factor in the latest price-sensitive company announcements or qualitative material. Thank you for reading.
