Does Fortinet, Inc. (NASDAQ:FTNT) Have A Good P/E Ratio?

Today, we'll introduce the concept of the P/E ratio for those who are learning about investing. We'll look at Fortinet, Inc.'s (NASDAQ:FTNT) P/E ratio and reflect on what it tells us about the company's share price. Based on the last twelve months, Fortinet's P/E ratio is 35.75. That means that at current prices, buyers pay $35.75 for every $1 in trailing yearly profits.
Check out our latest analysis for Fortinet
How Do You Calculate Fortinet's P/E Ratio?
The formula for price to earnings is:
Price to Earnings Ratio = Share Price ÷ Earnings per Share (EPS)
Or for Fortinet:
P/E of 35.75 = $78.23 ÷ $2.19 (Based on the trailing twelve months to June 2019.)
Is A High Price-to-Earnings Ratio Good?
A higher P/E ratio means that investors are paying a higher price for each $1 of company earnings. That is not a good or a bad thing per se, but a high P/E does imply buyers are optimistic about the future.
Does Fortinet Have A Relatively High Or Low P/E For Its Industry?
The P/E ratio essentially measures market expectations of a company. If you look at the image below, you can see Fortinet has a lower P/E than the average (48.1) in the software industry classification.
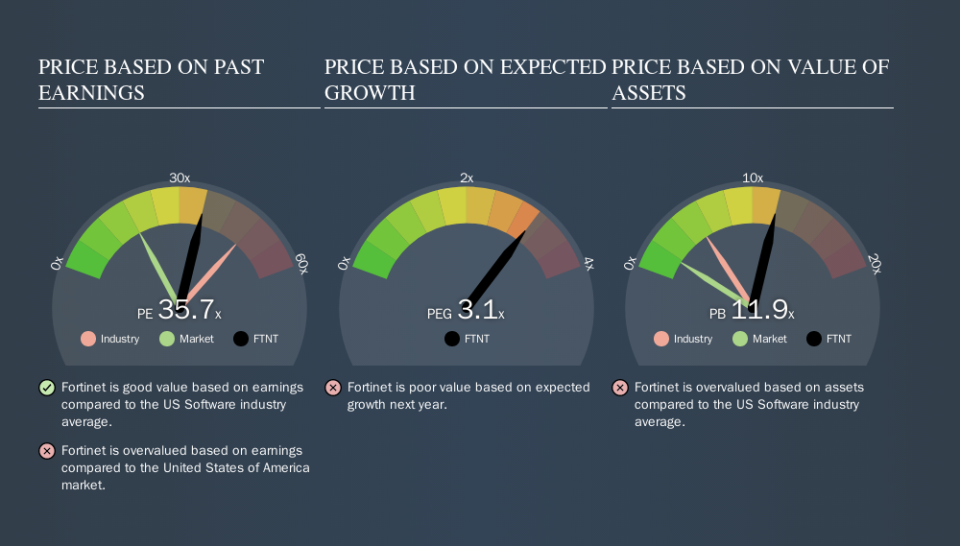
Its relatively low P/E ratio indicates that Fortinet shareholders think it will struggle to do as well as other companies in its industry classification. While current expectations are low, the stock could be undervalued if the situation is better than the market assumes. It is arguably worth checking if insiders are buying shares, because that might imply they believe the stock is undervalued.
How Growth Rates Impact P/E Ratios
P/E ratios primarily reflect market expectations around earnings growth rates. That's because companies that grow earnings per share quickly will rapidly increase the 'E' in the equation. And in that case, the P/E ratio itself will drop rather quickly. And as that P/E ratio drops, the company will look cheap, unless its share price increases.
Fortinet's earnings made like a rocket, taking off 322% last year. The sweetener is that the annual five year growth rate of 57% is also impressive. So I'd be surprised if the P/E ratio was not above average.
A Limitation: P/E Ratios Ignore Debt and Cash In The Bank
One drawback of using a P/E ratio is that it considers market capitalization, but not the balance sheet. Thus, the metric does not reflect cash or debt held by the company. Hypothetically, a company could reduce its future P/E ratio by spending its cash (or taking on debt) to achieve higher earnings.
While growth expenditure doesn't always pay off, the point is that it is a good option to have; but one that the P/E ratio ignores.
Fortinet's Balance Sheet
Fortinet has net cash of US$1.8b. This is fairly high at 14% of its market capitalization. That might mean balance sheet strength is important to the business, but should also help push the P/E a bit higher than it would otherwise be.
The Bottom Line On Fortinet's P/E Ratio
Fortinet trades on a P/E ratio of 35.7, which is above its market average of 17.9. The excess cash it carries is the gravy on top its fast EPS growth. So based on this analysis we'd expect Fortinet to have a high P/E ratio.
When the market is wrong about a stock, it gives savvy investors an opportunity. People often underestimate remarkable growth -- so investors can make money when fast growth is not fully appreciated. So this free visualization of the analyst consensus on future earnings could help you make the right decision about whether to buy, sell, or hold.
Of course you might be able to find a better stock than Fortinet. So you may wish to see this free collection of other companies that have grown earnings strongly.
We aim to bring you long-term focused research analysis driven by fundamental data. Note that our analysis may not factor in the latest price-sensitive company announcements or qualitative material.
If you spot an error that warrants correction, please contact the editor at editorial-team@simplywallst.com. This article by Simply Wall St is general in nature. It does not constitute a recommendation to buy or sell any stock, and does not take account of your objectives, or your financial situation. Simply Wall St has no position in the stocks mentioned. Thank you for reading.
