Does Griffin Mining Limited’s (LON:GFM) PE Ratio Warrant A Sell?

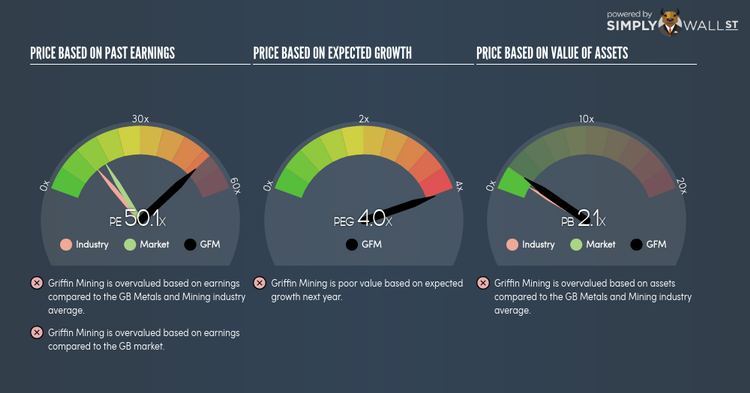
Griffin Mining Limited (AIM:GFM) trades with a trailing P/E of 50.1x, which is higher than the industry average of 12.9x. Although some investors may jump to the conclusion that you should avoid the stock or sell if you own it, understanding the assumptions behind the P/E ratio might change your mind. Today, I will explain what the P/E ratio is as well as what you should look out for when using it. See our latest analysis for Griffin Mining
What you need to know about the P/E ratio
The P/E ratio is a popular ratio used in relative valuation since earnings power is a key driver of investment value. By comparing a stock’s price per share to its earnings per share, we are able to see how much investors are paying for each pound of the company’s earnings.
P/E Calculation for GFM
Price-Earnings Ratio = Price per share ÷ Earnings per share
GFM Price-Earnings Ratio = $1.74 ÷ $0.035 = 50.1x
The P/E ratio itself doesn’t tell you a lot; however, it becomes very insightful when you compare it with other similar companies. We want to compare the stock’s P/E ratio to the average of companies that have similar characteristics as GFM, such as size and country of operation. A quick method of creating a peer group is to use companies in the same industry, which is what I will do. Since GFM’s P/E of 50.1x is higher than its industry peers (12.9x), it means that investors are paying more than they should for each dollar of GFM’s earnings. As such, our analysis shows that GFM represents an over-priced stock.
Assumptions to watch out for
Before you jump to the conclusion that GFM should be banished from your portfolio, it is important to realise that our conclusion rests on two assertions. Firstly, our peer group contains companies that are similar to GFM. If this isn’t the case, the difference in P/E could be due to other factors. For example, if you are comparing lower risk firms with GFM, then its P/E would naturally be lower than its peers, as investors would value those with lower risk at a higher price. The second assumption that must hold true is that the stocks we are comparing GFM to are fairly valued by the market. If this does not hold, there is a possibility that GFM’s P/E is lower because our peer group is overvalued by the market.
To help readers see pass the short term volatility of the financial market, we aim to bring you a long-term focused research analysis purely driven by fundamental data. Note that our analysis does not factor in the latest price sensitive company announcements.
The author is an independent contributor and at the time of publication had no position in the stocks mentioned.
