Does Hexatronic Group AB (publ)’s (STO:HTRO) Recent Track Record Look Strong?

Assessing Hexatronic Group AB (publ)’s (STO:HTRO) past track record of performance is an insightful exercise for investors. It allows us to reflect on whether or not the company has met or exceed expectations, which is a great indicator for future performance. Today I will assess HTRO’s recent performance announced on 31 March 2018 and evaluate these figures to its long-term trend and industry movements. Check out our latest analysis for Hexatronic Group
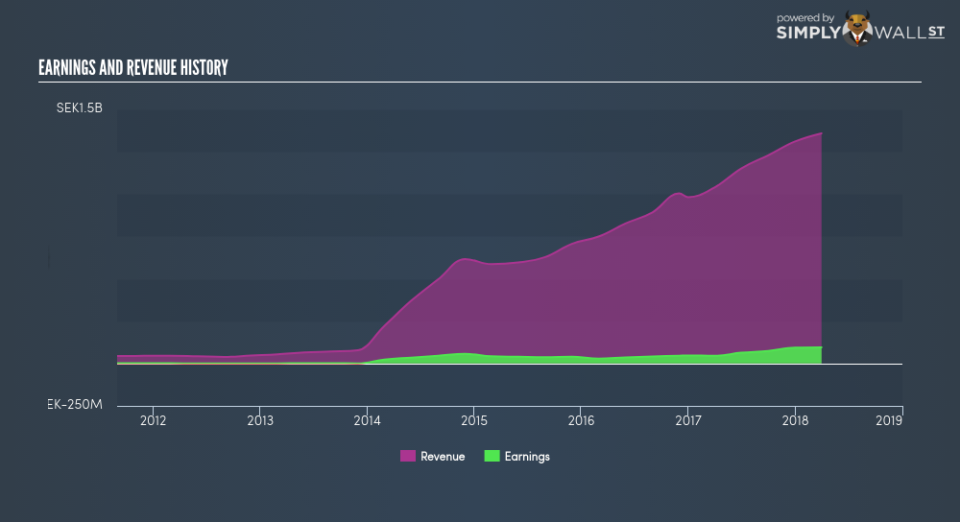
How Did HTRO’s Recent Performance Stack Up Against Its Past?
HTRO’s trailing twelve-month earnings (from 31 March 2018) of kr95.92m has more than doubled from kr47.99m in the prior year. Furthermore, this one-year growth rate has exceeded its 5-year annual growth average of 39.26%, indicating the rate at which HTRO is growing has accelerated. What’s enabled this growth? Let’s see whether it is merely owing to industry tailwinds, or if Hexatronic Group has seen some company-specific growth.
The rise in earnings seems to be supported by a strong top-line increase outstripping its growth rate of expenses. Though this has caused a margin contraction, it has made Hexatronic Group more profitable. Viewing growth from a sector-level, the SE electrical industry has been growing its average earnings by double-digit 13.13% in the prior year, and 16.06% over the past half a decade. This means that any uplift the industry is benefiting from, Hexatronic Group is able to amplify this to its advantage.
In terms of returns from investment, Hexatronic Group has invested its equity funds well leading to a 22.26% return on equity (ROE), above the sensible minimum of 20%. Furthermore, its return on assets (ROA) of 7.99% exceeds the SE Electrical industry of 7.22%, indicating Hexatronic Group has used its assets more efficiently. However, its return on capital (ROC), which also accounts for Hexatronic Group’s debt level, has declined over the past 3 years from 26.17% to 14.54%. This correlates with an increase in debt holding, with debt-to-equity ratio rising from 63.39% to 75.20% over the past 5 years.
What does this mean?
Though Hexatronic Group’s past data is helpful, it is only one aspect of my investment thesis. Positive growth and profitability are what investors like to see in a company’s track record, but how do we properly assess sustainability? You should continue to research Hexatronic Group to get a better picture of the stock by looking at:
Future Outlook: What are well-informed industry analysts predicting for HTRO’s future growth? Take a look at our free research report of analyst consensus for HTRO’s outlook.
Financial Health: Is HTRO’s operations financially sustainable? Balance sheets can be hard to analyze, which is why we’ve done it for you. Check out our financial health checks here.
Other High-Performing Stocks: Are there other stocks that provide better prospects with proven track records? Explore our free list of these great stocks here.
NB: Figures in this article are calculated using data from the trailing twelve months from 31 March 2018. This may not be consistent with full year annual report figures.
To help readers see pass the short term volatility of the financial market, we aim to bring you a long-term focused research analysis purely driven by fundamental data. Note that our analysis does not factor in the latest price sensitive company announcements.
The author is an independent contributor and at the time of publication had no position in the stocks mentioned.
