How Does HGL's (ASX:HNG) P/E Compare To Its Industry, After Its Big Share Price Gain?

HGL (ASX:HNG) shareholders are no doubt pleased to see that the share price has had a great month, posting a 36% gain, recovering from prior weakness. But shareholders may not all be feeling jubilant, since the share price is still down 20% in the last year.
Assuming no other changes, a sharply higher share price makes a stock less attractive to potential buyers. While the market sentiment towards a stock is very changeable, in the long run, the share price will tend to move in the same direction as earnings per share. The implication here is that deep value investors might steer clear when expectations of a company are too high. Perhaps the simplest way to get a read on investors' expectations of a business is to look at its Price to Earnings Ratio (PE Ratio). A high P/E implies that investors have high expectations of what a company can achieve compared to a company with a low P/E ratio.
See our latest analysis for HGL
Does HGL Have A Relatively High Or Low P/E For Its Industry?
HGL has a P/E ratio of 17.87. You can see in the image below that the average P/E (18.8) for companies in the trade distributors industry is roughly the same as HGL's P/E.
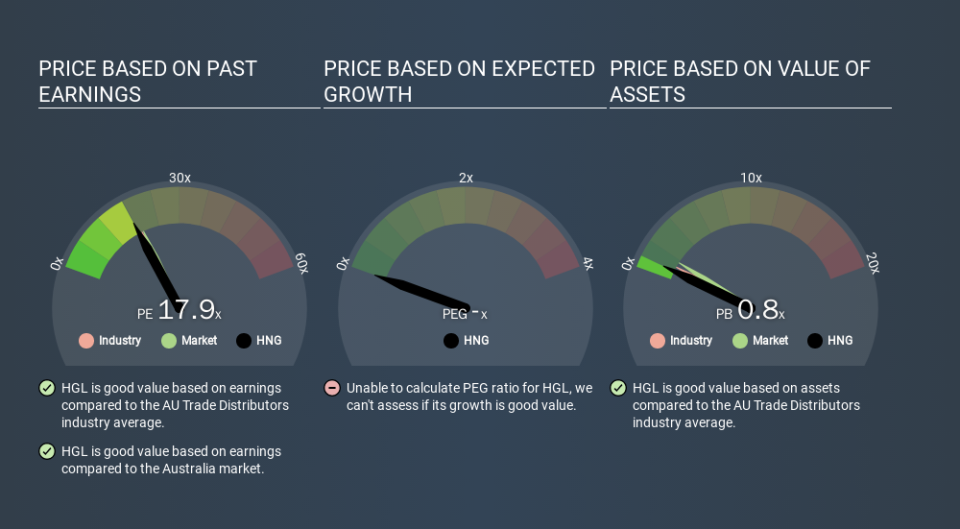
That indicates that the market expects HGL will perform roughly in line with other companies in its industry. If the company has better than average prospects, then the market might be underestimating it. I would further inform my view by checking insider buying and selling., among other things.
How Growth Rates Impact P/E Ratios
If earnings fall then in the future the 'E' will be lower. That means even if the current P/E is low, it will increase over time if the share price stays flat. Then, a higher P/E might scare off shareholders, pushing the share price down.
HGL saw earnings per share decrease by 51% last year. And EPS is down 38% a year, over the last 3 years. This might lead to low expectations.
A Limitation: P/E Ratios Ignore Debt and Cash In The Bank
Don't forget that the P/E ratio considers market capitalization. That means it doesn't take debt or cash into account. The exact same company would hypothetically deserve a higher P/E ratio if it had a strong balance sheet, than if it had a weak one with lots of debt, because a cashed up company can spend on growth.
Such spending might be good or bad, overall, but the key point here is that you need to look at debt to understand the P/E ratio in context.
How Does HGL's Debt Impact Its P/E Ratio?
The extra options and safety that comes with HGL's AU$247k net cash position means that it deserves a higher P/E than it would if it had a lot of net debt.
The Bottom Line On HGL's P/E Ratio
HGL's P/E is 17.9 which is about average (19.2) in the AU market. While the lack of recent growth is probably muting optimism, the net cash position means it's not surprising that expectations put the company roughly in line with the market average P/E. What is very clear is that the market has become more optimistic about HGL over the last month, with the P/E ratio rising from 13.1 back then to 17.9 today. If you like to buy stocks that have recently impressed the market, then this one might be a candidate; but if you prefer to invest when there is 'blood in the streets', then you may feel the opportunity has passed.
When the market is wrong about a stock, it gives savvy investors an opportunity. If it is underestimating a company, investors can make money by buying and holding the shares until the market corrects itself. Although we don't have analyst forecasts you might want to assess this data-rich visualization of earnings, revenue and cash flow.
You might be able to find a better buy than HGL. If you want a selection of possible winners, check out this free list of interesting companies that trade on a P/E below 20 (but have proven they can grow earnings).
If you spot an error that warrants correction, please contact the editor at editorial-team@simplywallst.com. This article by Simply Wall St is general in nature. It does not constitute a recommendation to buy or sell any stock, and does not take account of your objectives, or your financial situation. Simply Wall St has no position in the stocks mentioned.
We aim to bring you long-term focused research analysis driven by fundamental data. Note that our analysis may not factor in the latest price-sensitive company announcements or qualitative material. Thank you for reading.
